- Home
- /
- Programming
- /
- Graphics
- /
- Re: Regression plot using GPLOT
- RSS Feed
- Mark Topic as New
- Mark Topic as Read
- Float this Topic for Current User
- Bookmark
- Subscribe
- Mute
- Printer Friendly Page

- Mark as New
- Bookmark
- Subscribe
- Mute
- RSS Feed
- Permalink
- Report Inappropriate Content
Hi there,
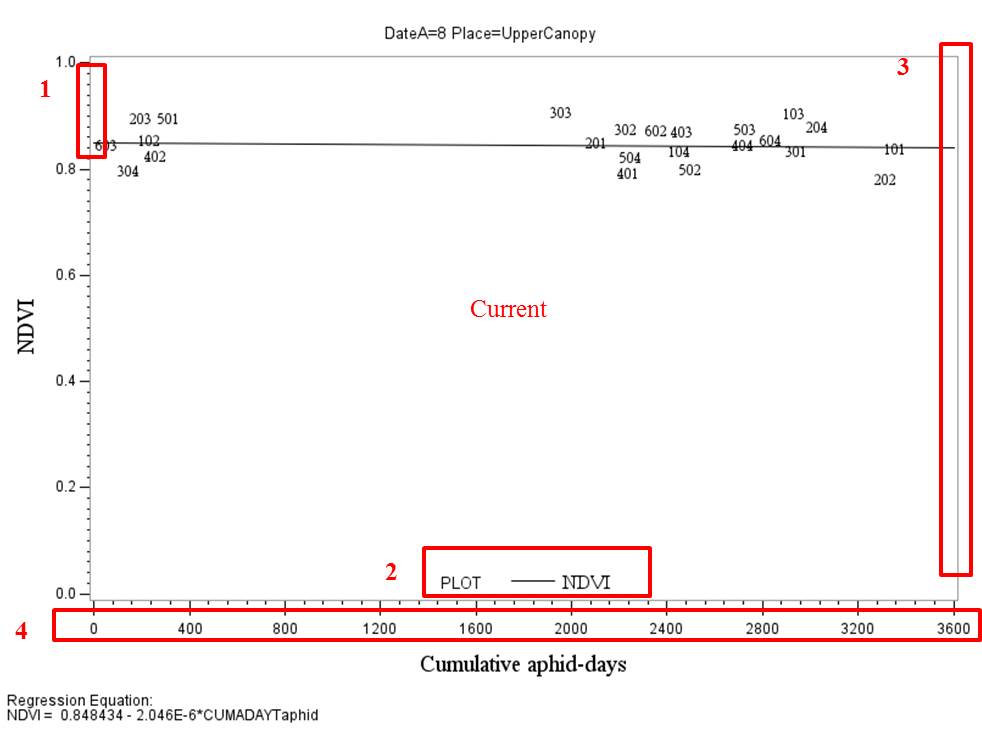
I have the following script to plot regression models, but there are four main problems that I could not figure out using the available manuals:
1) Remove minor ticks in both axis.
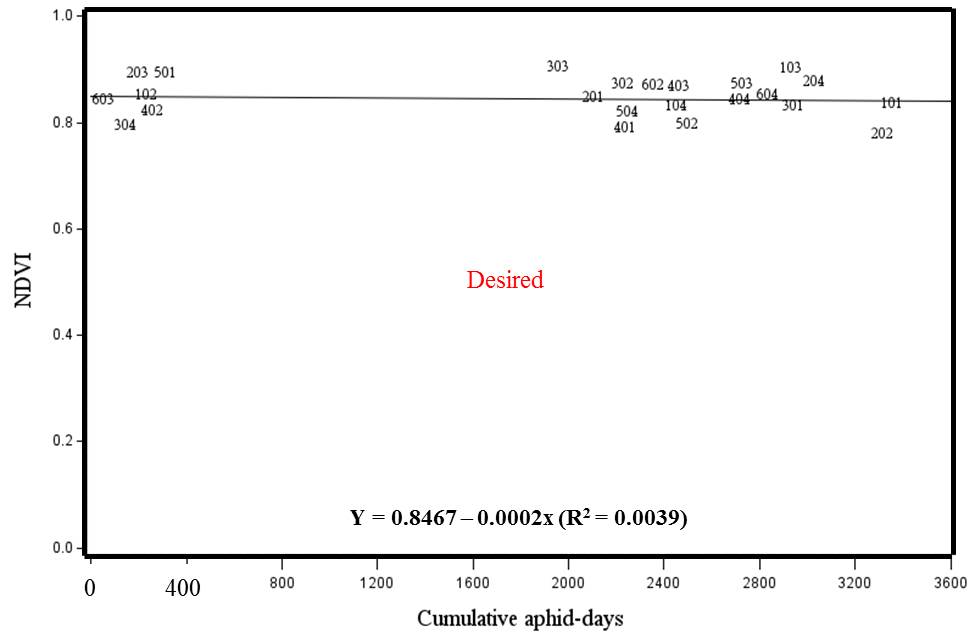
2) Include the linear regression model inside the graph using three decimal cases and rename the variables, i.e., Y = a – bx (R2 = 0.003).
3) Graph frame should be thicker.
4) Size of the number of both axis should size 12pt.
I included the current output and the desired graph to ilustrate what I need.
Thank you so much for considering helping.
 .
.
LEGEND1 value=(f=times h=12pt)
POSITION= (bottom center inside)
MODE=protect
noframe;
AXIS1 major =(h=1)
order=(0 to 3600 by 400)
LABEL=(ANGLE=360 ROTATE=0 HEIGHT=14pt font=times 'Cumulative aphid-days');
SYMBOL1 pointlabel = ("#Plot" h=2 font=times h=10pt color=black) value=none I=RL;
AXIS2 major =(h=1)
order=(0 to 1 by 0.2)
LABEL=(ANGLE=90 ROTATE=0 HEIGHT=14pt font=times 'NDVI');
SYMBOL2 color=black font=times;
PROC SORT DATA=ALLOPENP; BY DateA Place; RUN;
proc gplot data=ALLOPENP; BY DateA Place;
plot NDVI*CUMADAYTaphid/
haxis =axis1
vaxis =axis2
caxis=black
regeqn
legend=legend1;
run;quit;

- Mark as New
- Bookmark
- Subscribe
- Mute
- RSS Feed
- Permalink
- Report Inappropriate Content
1) Remove minor ticks in both axis.
axis2 minor=none;
2) Include the linear regression model inside the graph using three decimal cases and rename the variables, i.e., Y = a – bx (R2 = 0.003).
You'll probably have to calculate the values, and then stuff them into a custom text string, and annotate it onto the graph.
3) Graph frame should be thicker.
axis2 width=2
4) Size of the number of both axis should size 12pt.
axis2 value=(height=12pt)
- Mark as New
- Bookmark
- Subscribe
- Mute
- RSS Feed
- Permalink
- Report Inappropriate Content
Thank you Robert.
Considering your suggestion for question (2), I calculated the values and called them in a macro variable.
However, I have a BY statement and the macro variable saved only the last intercept and slope.
Any idea how to save the values for each DATE and PLACE? I am thinking to use each value in a custom text string onto the graph.
PROC REG DATA=ALLOPENP; BY DateA Place;
MODEL NDVI=CUMADAYTaphid;
ODS OUTPUT ParameterEstimates=estimates FitStatistics=stats;
run;
DATA reg_results; MERGE estimates stats; BY DateA Place;
if variable="CUMADAYTaphid" then call symput("slope", estimate);
if variable="Intercept" then call symput("intercept", estimate);
if Label2="R-Square" then call symput("rsquare", cValue2);
run;

- Mark as New
- Bookmark
- Subscribe
- Mute
- RSS Feed
- Permalink
- Report Inappropriate Content
You need to add in an N to your slope, so that you have multiple slope macro variables, ie
slope1 slope2 ... slopeN
DATA reg_results; MERGE estimates stats; BY DateA Place;
if variable="CUMADAYTaphid" then call symput("slope"||put(_n_,2. -l), estimate);
if variable="Intercept" then call symput("intercept"||put(_n_,2. -l), estimate);
if Label2="R-Square" then call symput("rsquare"||put(_n_,2. -l), cValue2);
run;

- Mark as New
- Bookmark
- Subscribe
- Mute
- RSS Feed
- Permalink
- Report Inappropriate Content
For putting a regression equation on each graph, have a look at the ANNOTATE facility. You can use that with BY group processing, so once you have figured out how to use it for one graph (takes a bit of work) it should be straight foward getting what you want for all the graphs.
.jpg")
Catch up on SAS Innovate 2026
Nearly 200 sessions are now available on demand with the SAS Innovate Digital Pass.
Explore Now →Learn how use the CAT functions in SAS to join values from multiple variables into a single value.

Find more tutorials on the SAS Users YouTube channel.
SAS Training: Just a Click Away
Ready to level-up your skills? Choose your own adventure.
-
4 replies
-
02-12-2014 02:00 PM
-
3273 views
-
3 likes
-
4 in conversation
-
