- Home
- /
- Programming
- /
- Graphics
- /
- Proc sgplot: how subscipt and superscript xaxis and yaxis (such H2O)?
- RSS Feed
- Mark Topic as New
- Mark Topic as Read
- Float this Topic for Current User
- Bookmark
- Subscribe
- Mute
- Printer Friendly Page

- Mark as New
- Bookmark
- Subscribe
- Mute
- RSS Feed
- Permalink
- Report Inappropriate Content
Using Proc sgplot, and having some numbers needed to be subscript.
Tried to use
ODS escpechar='^"; and move options, but they did not work.
Data test;
input x y;
datalines;
1 2
3 6
7 10
8 19
;
run;
proc sgplot data=test;
scatter x=x y=y;
xaxis label="H2O";
yaxis label ="(NH3)2SO4";
run;

- Mark as New
- Bookmark
- Subscribe
- Mute
- RSS Feed
- Permalink
- Report Inappropriate Content
Take a look at: http://support.sas.com/kb/39/267.html
- Mark as New
- Bookmark
- Subscribe
- Mute
- RSS Feed
- Permalink
- Report Inappropriate Content
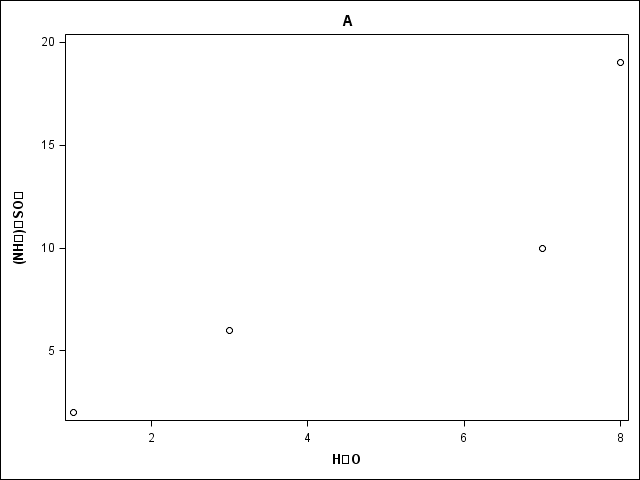
Thanks, I tried the following code, the output was not correct.
Data test;
input x y;
datalines;
1 2
3 6
7 10
8 19
;
run;
ODS escapechar='^';
proc sgplot data=test;
scatter x=x y=y;
xaxis label="H^{unicode '2082'x}O";
yaxis label ="(NH^{unicode '2083'x})^{unicode '2082'x}SO^{unicode '2084'x}";
run;

- Mark as New
- Bookmark
- Subscribe
- Mute
- RSS Feed
- Permalink
- Report Inappropriate Content
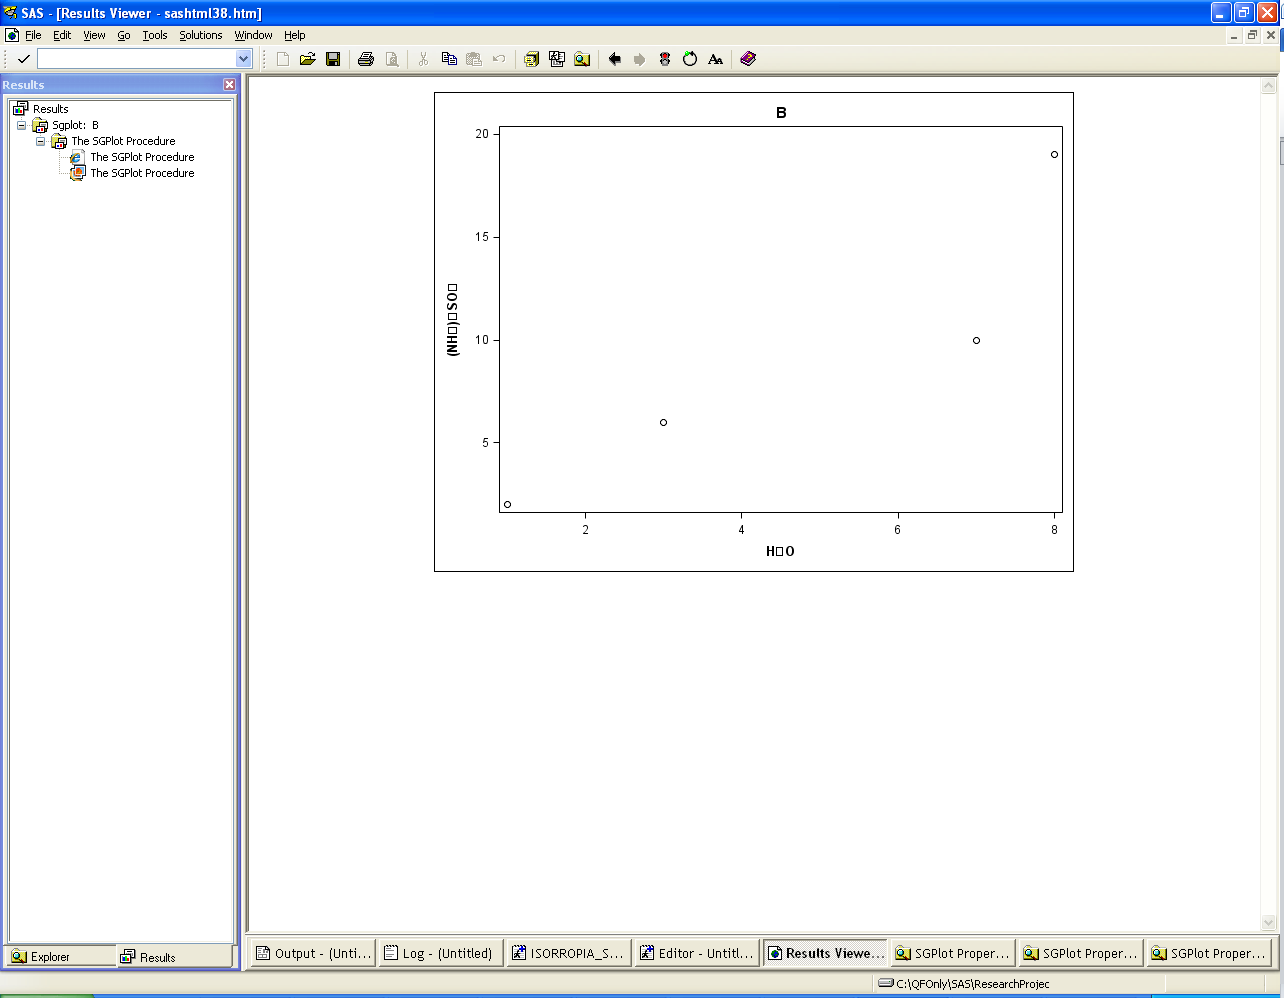
The reason you're seeing the boxes is that the font you're using does not support enough of the Unicode specification to include all of the superscipt and subscript values. The example referenced by Art contained a little piece of code similar to the one below:
proc template;
define style style.unifonts;
parent=Styles.Listing; /* or your favorite style */
style Graphfonts from GraphFonts /
'GraphValueFont' = ("Monotype San WT J",12pt)
'GraphLabelFont' = ("Monotype San WT J",14pt)
'GraphDataFont' = ("Monotype San WT J",12pt)
'GraphTitleFont' = ("Monotype San WT J",12pt);
end;
run;
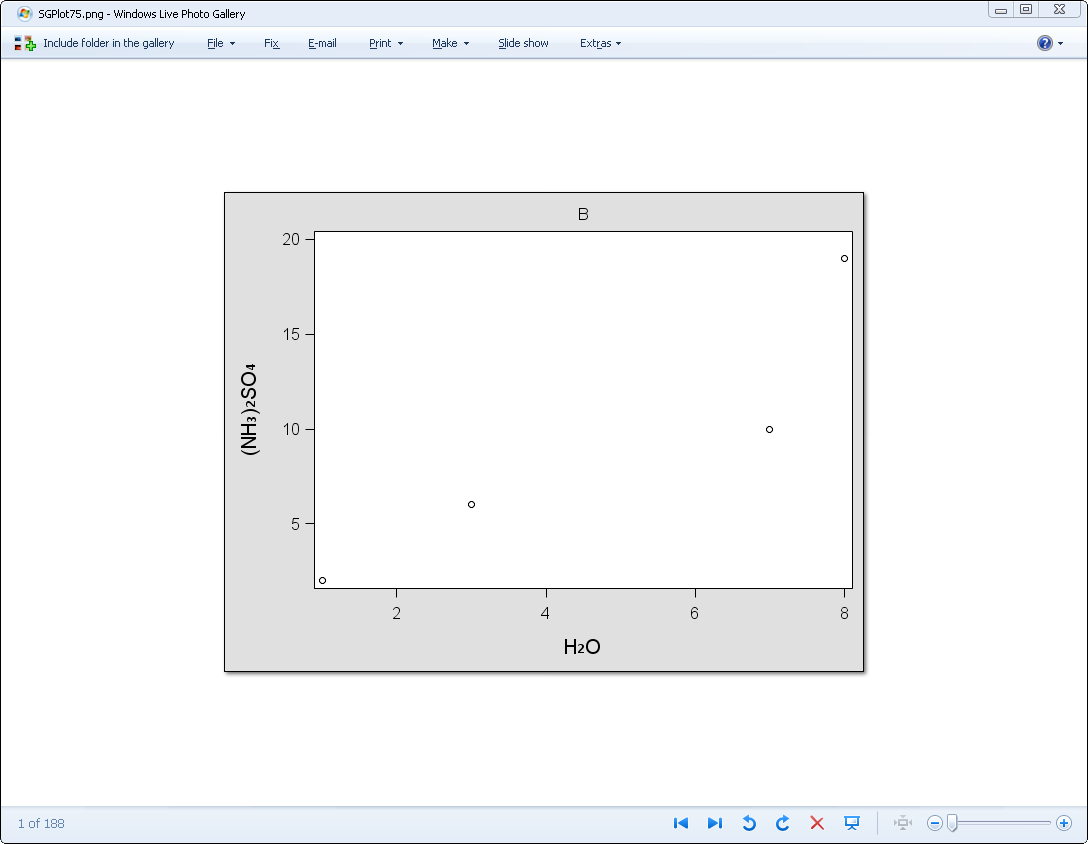
If you set this style as your ODS style, then you're boxes will be filled! 🙂
ods listing style=unifonts;
data test;
input x y;
datalines;
1 2
3 6
7 10
8 19
;
run;
ods escapechar='^';
proc sgplot data=test;
scatter x=x y=y;
xaxis label="H^{unicode '2082'x}O";
yaxis label ="(NH^{unicode '2083'x})^{unicode '2082'x}SO^{unicode '2084'x}";
run;
Hope this helps,
Dan
- Mark as New
- Bookmark
- Subscribe
- Mute
- RSS Feed
- Permalink
- Report Inappropriate Content
Thanks Dan!
the HTML Type output was not correct.
The PNG Type output was correct.
Normally I copy the figure from HTML Type, because it looks very neat.
- Mark as New
- Bookmark
- Subscribe
- Mute
- RSS Feed
- Permalink
- Report Inappropriate Content
Seemed to work ok for me. Did I miss something? The code I used was:
Data test;
input x y;
datalines;
1 2
3 6
7 10
8 19
;
proc template;
define style unifonts;
parent=Styles.Default;
style Graphfonts from GraphFonts /
'GraphValueFont' = ("Monotype San WT J",12pt)
'GraphLabelFont' = ("Monotype San WT J",14pt)
'GraphDataFont' = ("Monotype San WT J",12pt)
'GraphTitleFont' = ("Monotype San WT J",12pt);
end;
run;
ods escapechar='^';
ods listing close;
ods html file='subsuper.html' path='c:\art' style=unifonts;
ods graphics / reset width=600px height=400px imagename='SubSuper' imagefmt=gif;
title 'Using Subscripts and Superscripts';
proc sgplot data=test;
scatter x=x y=y;
xaxis label="H^{unicode '2082'x}O";
yaxis label ="(NH^{unicode '2083'x})^{unicode '2082'x}SO^{unicode '2084'x}";
run;
ods html close;
ods listing;
.jpg")
Catch up on SAS Innovate 2026
Nearly 200 sessions are now available on demand in the Innovate Hub.
Watch Now →Learn how use the CAT functions in SAS to join values from multiple variables into a single value.

Find more tutorials on the SAS Users YouTube channel.
SAS Training: Just a Click Away
Ready to level-up your skills? Choose your own adventure.
-
5 replies
-
12-21-2011 03:07 PM
-
8314 views
-
6 likes
-
3 in conversation
-
