- Home
- /
- Programming
- /
- Graphics
- /
- Proc SGPLOT - Extend trend line full width of graph
- RSS Feed
- Mark Topic as New
- Mark Topic as Read
- Float this Topic for Current User
- Bookmark
- Subscribe
- Mute
- Printer Friendly Page

- Mark as New
- Bookmark
- Subscribe
- Mute
- RSS Feed
- Permalink
- Report Inappropriate Content
I am using the reg statement in proc sgplot to create a trend line -- I'd like the trend line to begin at the y axis, not begin with the first data point. I couldn't find a way to do this with lineattrs in the documentation. Any tips are greatly appreciated. Thanks
proc sgplot data=sample;
scatter x=x y= y;
reg x=x y=y /nomarks lineattrs=(color=black);
run;
Accepted Solutions

- Mark as New
- Bookmark
- Subscribe
- Mute
- RSS Feed
- Permalink
- Report Inappropriate Content
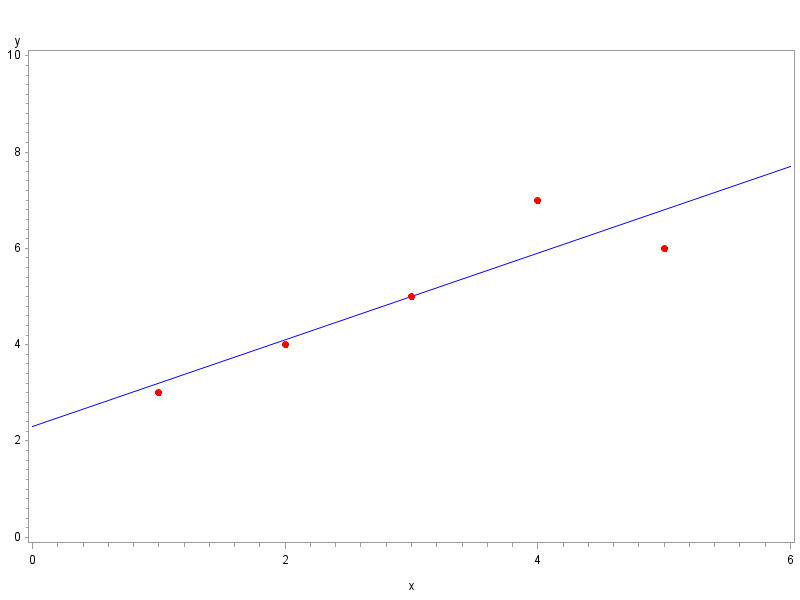
The behavior you're describing is the default for Proc Gplot - here's an example:
data foo;
input x y;
datalines;
1 3
2 4
3 5
4 7
5 6
;
run;
symbol1 value=none interpol=rl color=blue;
symbol2 value=dot interpol=none color=red;
axis1 order=(0 to 6 by 2);
axis2 order=(0 to 10 by 2);
proc gplot data=foo;
plot y*x=1 y*x=2 / overlay haxis=axis1 vaxis=axis2;
run;

- Mark as New
- Bookmark
- Subscribe
- Mute
- RSS Feed
- Permalink
- Report Inappropriate Content
You cannot "extend" the fit line, but you can remove the extra white space. Try setting OFFSETMIN=0 and THRESHOLDMIN=0 (SAS 9.3) on the x axis. Same on the other end.
- Mark as New
- Bookmark
- Subscribe
- Mute
- RSS Feed
- Permalink
- Report Inappropriate Content
The behavior you're describing is the default for Proc Gplot - here's an example:
data foo;
input x y;
datalines;
1 3
2 4
3 5
4 7
5 6
;
run;
symbol1 value=none interpol=rl color=blue;
symbol2 value=dot interpol=none color=red;
axis1 order=(0 to 6 by 2);
axis2 order=(0 to 10 by 2);
proc gplot data=foo;
plot y*x=1 y*x=2 / overlay haxis=axis1 vaxis=axis2;
run;
.jpg")
Catch up on SAS Innovate 2026
Nearly 200 sessions are now available on demand in the Innovate Hub.
Watch Now →Learn how use the CAT functions in SAS to join values from multiple variables into a single value.

Find more tutorials on the SAS Users YouTube channel.
SAS Training: Just a Click Away
Ready to level-up your skills? Choose your own adventure.
-
2 replies
-
01-28-2014 01:32 PM
-
7519 views
-
3 likes
-
3 in conversation
-
