- Home
- /
- Programming
- /
- Graphics
- /
- Re: (Proc MAPIMPORT / GMAP) Weird lines when mapping imported map of ...
- RSS Feed
- Mark Topic as New
- Mark Topic as Read
- Float this Topic for Current User
- Bookmark
- Subscribe
- Mute
- Printer Friendly Page
- Mark as New
- Bookmark
- Subscribe
- Mute
- RSS Feed
- Permalink
- Report Inappropriate Content
Hi SAS,
I am a total newbie to Proc GMAP and GIS in general. I am trying to create some maps of Canada at the Province (PR), Census Division (CD), Census Subdivision (CSD) and Dissemination Area (DA) levels. I would also like to add a population ecumene layer on top of the map in order to mask the unpopulated areas
The province map provided in SAS is outdated by almost 2 decades as it doesnt include the territory of Nunavut, created in 1999. However, one can download the Cartography Boundary Files (CBF) from Statistics Canada
I have managed to import, project and map the Province/Territories data and have a satisfying result. However, I get weird connecting lines when trying to map the imported "Population Ecumene" file. The results are below. Note the horizontal lines in the north west territories and through the Hudson Bay.
My code is shared below the images. Any help would be greatly appreciated. My follow up question is as follow: I would like to have a map of the provinces, but blank out all the area where ECUMEN="0".
Cheers,
Simon
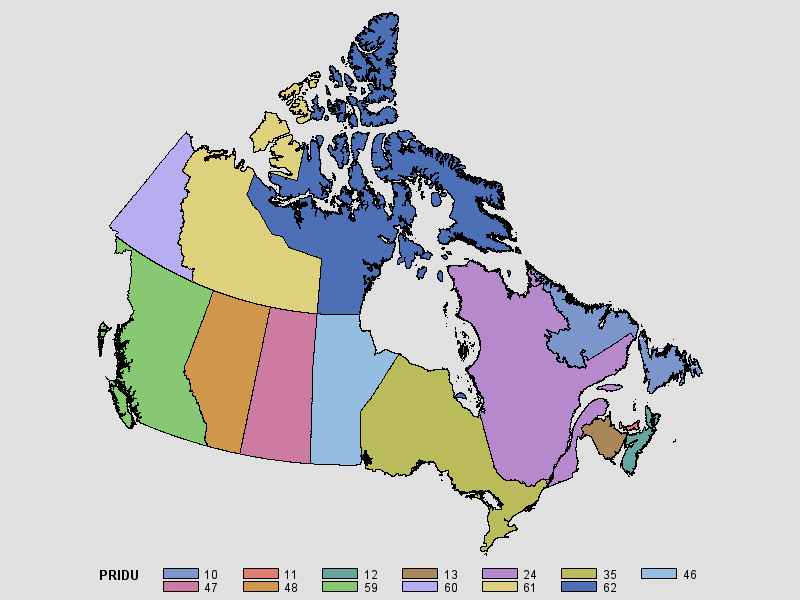
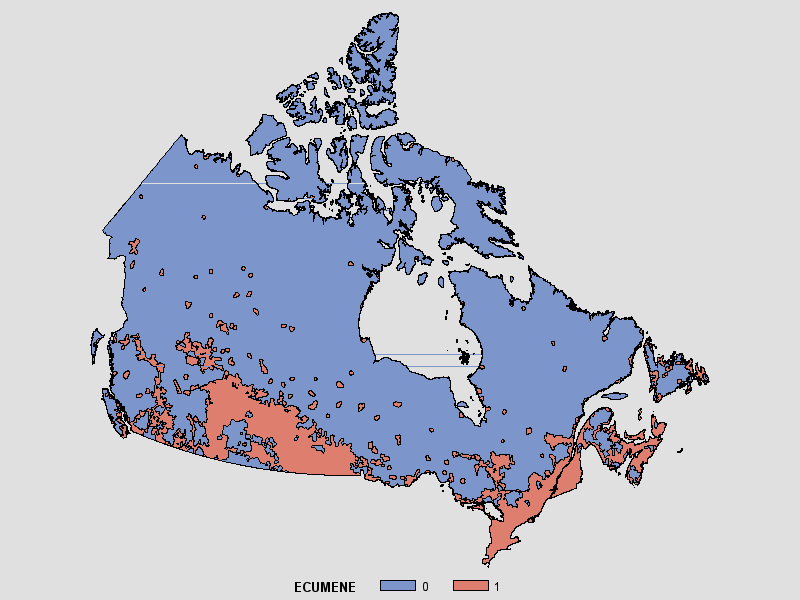
libname temp "c:\TEMP";
proc mapimport
out=temp.Ecu_nonproj
datafile="C:\maps\cBf\gecu000e11a_e\gecu000e11a_e.shp";
id ecuid;
run;
proc gproject data=temp.ecu_nonproj out=temp.ECU_proj eastlong deg
project=lambert;
id ecuid;
run;
goptions reset=all;
ods html path="C:\temp";
proc gmap data=temp.ECU_proj map=temp.ECU_proj;
id ecuid;
choro ecumene;
run;
quit;
ods html close;
*************************************;
proc mapimport
out=temp.prov_nonproj
datafile=""C:\Tmaps\cBf\gpr_000b11a_f\gpr_000b11a_f.shp";
id pridu;
run;
proc gproject data=temp.prov_nonproj out=temp.prov_proj eastlong deg
project=lambert;
id pridu;
run;
goptions reset=all;
ods html path="C:\temp";
proc gmap data=temp.prov_proj map=temp.prov_proj;
id pridu;
choro pridu;
run;
quit;
ods html close;
Accepted Solutions
- Mark as New
- Bookmark
- Subscribe
- Mute
- RSS Feed
- Permalink
- Report Inappropriate Content
Looks like you're doing everything correctly!
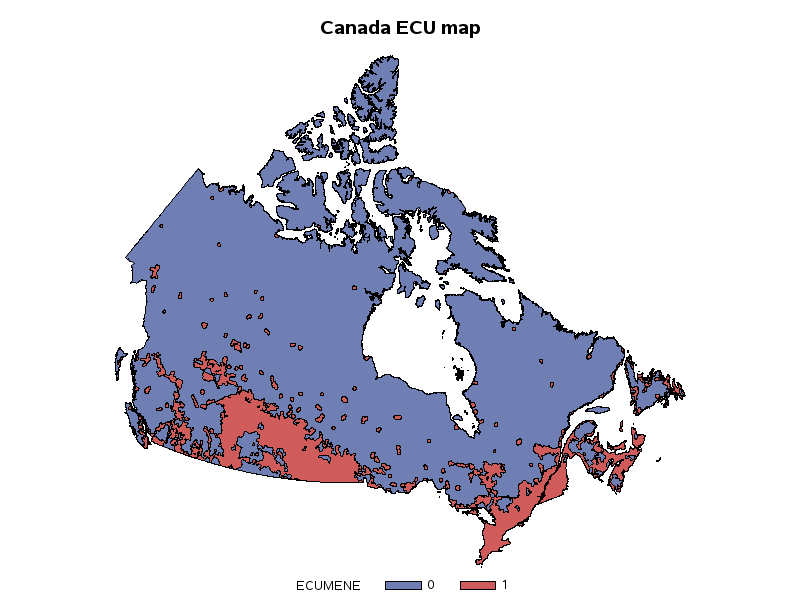
I downloaded your code, and the shape files, and was able to reproduce the "stray line" problem you were seeing. I reproduced it in SAS versions 9.2, 9.3, and 9.4, and the "work around" suggested by the gmap developers was to reduce the number of points used in the map (see Proc Greduce).
In releast 9.4-maintenance-1, the problem appears to have been fixed by our R&D group in China (internal tracking number S0905829, if you happen to be working with Tech Support on problems related to this). I ran your code using that release, and it came out clean, with no stray lines:

- Mark as New
- Bookmark
- Subscribe
- Mute
- RSS Feed
- Permalink
- Report Inappropriate Content
Hi Robert,
The speed and depth of your reply was definitely *way* above what I was hoping for and I had to show it to everyone within earshot. I talk very loud, too. Proc GREDUCE solved the issue stray line issue and I believe the cost of the islands up north actually look better. Thanks.
I'm afraid this will bring up another issue since I am trying to overlap two maps and that running GREDUCE might mean that the GREDUCED ecumene layer won't overlap perfectly with the province layer when trying to mask non-populated areas.
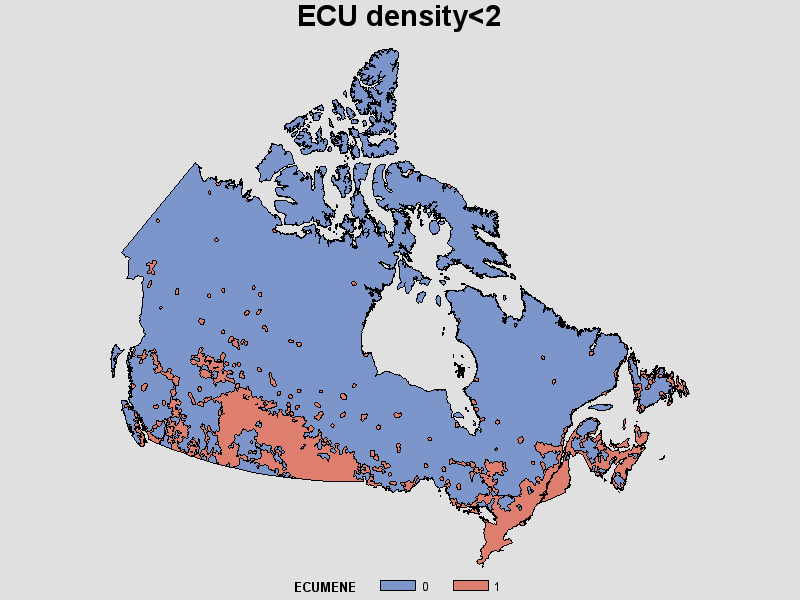
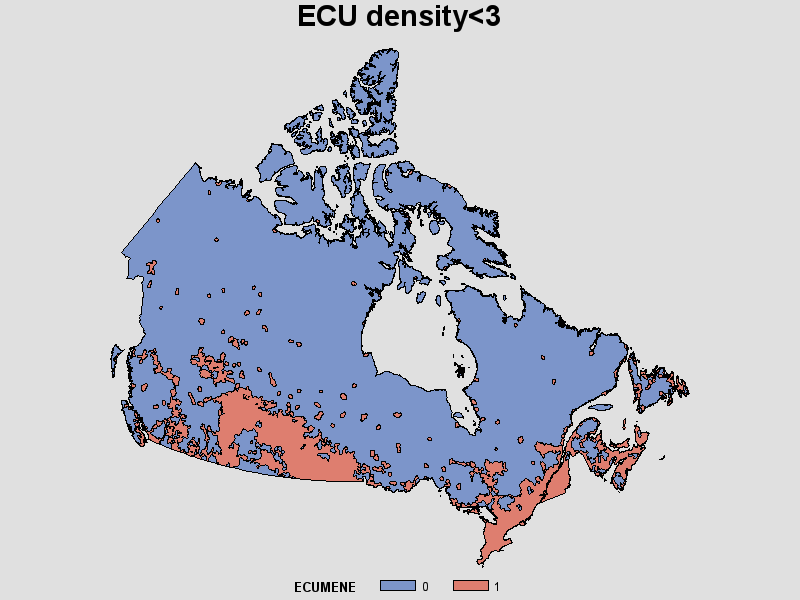
For anyone interested, here is my latest code for the ECUMENE part with the added Proc GREDUCE.
libname temp "c:\TEMP";
proc mapimport
out=temp.Ecu_nonproj
datafile="c:\maps\cBf\gecu000e11a_e\gecu000e11a_e.shp";
id ecuid;
run;
proc gproject data=temp.ecu_nonproj out=temp.ECU_proj eastlong deg
project=lambert;
id ecuid;
run;
proc greduce data= temp.Ecu_proj out= temp.Ecu_greduce;
id ecuid;
run;
goptions reset=all;
ods html path="C:\temp";
proc gmap data=temp.Ecu_greduce(where=(density<2)) map=temp.Ecu_greduce(where=(density<2));
id ecuid;
choro ecumene;
title "ECU density<2";
run;
quit;
proc gmap data=temp.Ecu_greduce(where=(density<3)) map=temp.Ecu_greduce(where=(density<3));
id ecuid;
choro ecumene;
title "ECU density<3";
run;
quit;
proc gmap data=temp.Ecu_greduce(where=(density<4)) map=temp.Ecu_greduce(where=(density<4));
id ecuid;
choro ecumene;
title "ECU density<4";
run;
quit;
ods html close;
- Mark as New
- Bookmark
- Subscribe
- Mute
- RSS Feed
- Permalink
- Report Inappropriate Content
Regarding the MAPS being too old, you should be using MAPSGFK instead.
MAPS are old and cannot change.
MAPSGFK are new and are supported by GfK GeoMarketing. We ship the maps when they are shipped to us.
These maps are not completely compatible with MAPS. For example, for Canada:
proc sort data=mapsgfk.canada out=smymap;
by id1 id; run;
proc gremove data=smymap out=mymap;
by id1; id id; run;
data mymap (drop=id1);
set mymap; id=id1; run;
proc gmap data=mymap map=mymap;
id id; choro id / nolegend; run;
- Mark as New
- Bookmark
- Subscribe
- Mute
- RSS Feed
- Permalink
- Report Inappropriate Content
Thanks for the post. I dont have SAS 9.4 yet but will make sure to give this a look when I do have ... Then again, I doubt they have the geography I need, and the province map is the only one that was working flawlessly ![]()
Googling for MAPSGFK led me to Robert's page about What's new in SAS GRAPH 9.4
and I can't wait to try these things
cheers
Simon
- Mark as New
- Bookmark
- Subscribe
- Mute
- RSS Feed
- Permalink
- Report Inappropriate Content
Simon,
MAPSGFK is there as long as you have SAS 9.3m1 or greater.
And you can load the latest maps from MapsOnLine (http://support.sas.com/mapsonline).
Darrell
- Mark as New
- Bookmark
- Subscribe
- Mute
- RSS Feed
- Permalink
- Report Inappropriate Content
good to know, thanks!
Learn how use the CAT functions in SAS to join values from multiple variables into a single value.
Find more tutorials on the SAS Users YouTube channel.
SAS Training: Just a Click Away
Ready to level-up your skills? Choose your own adventure.


