- Home
- /
- Programming
- /
- Graphics
- /
- Problem with GREPLAY in Guide
- RSS Feed
- Mark Topic as New
- Mark Topic as Read
- Float this Topic for Current User
- Bookmark
- Subscribe
- Mute
- Printer Friendly Page

- Mark as New
- Bookmark
- Subscribe
- Mute
- RSS Feed
- Permalink
- Report Inappropriate Content
Hi Experts!
I have this problem when I combine GChart or GPlot and after I want to combine those graphs using GReplay.
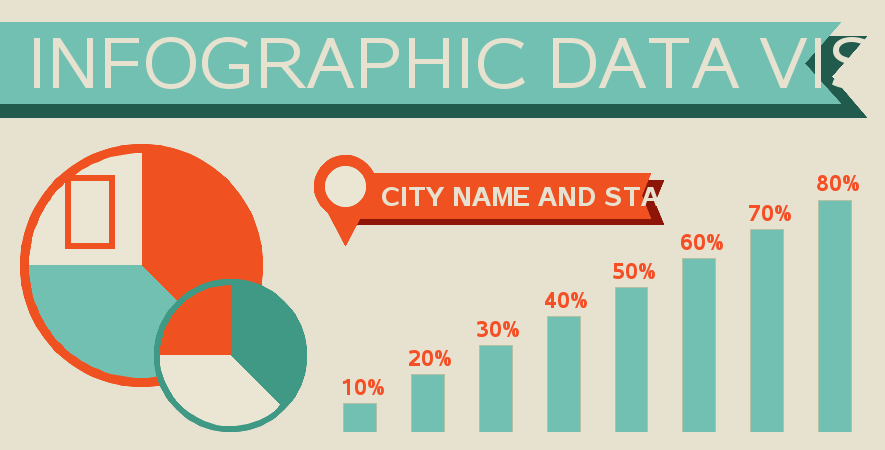
When I see the individual Graphs they look exactly as I want, for example like this:
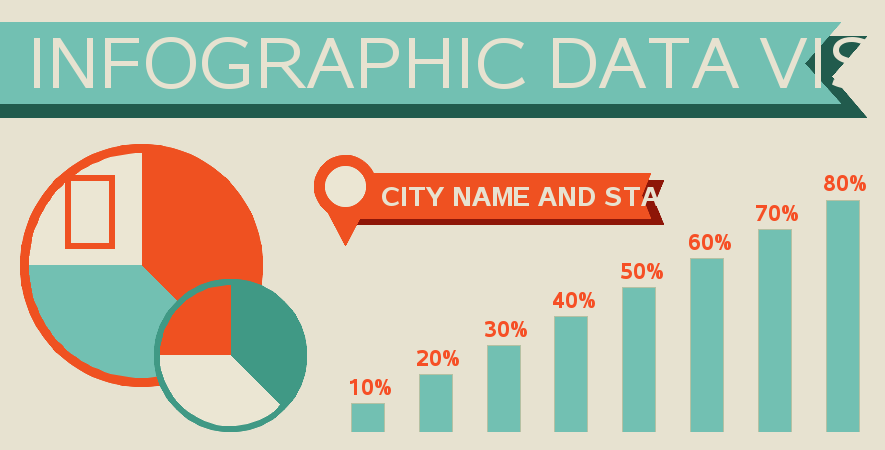
But when I call the image with GReplay look what happend with the bar graph:

The Graph made with GChart or GPlot grows a lot (is not only what I see in guide, it also happen when it create the phisical file in the server).
What can I do to solve that?

- Mark as New
- Bookmark
- Subscribe
- Mute
- RSS Feed
- Permalink
- Report Inappropriate Content
To get the graphs to look good in greplay, you will need to pay close attention to the xpixels & ypixels sizes ...
First look at the xpixels size of the final greplay output, and then calculate what size the graphs will be in their 'holes' in the template (for each graph). Once you have figured those sizes, specify them as the xpixels/ypixels when you're creating the individual images. Otherwise some pieces of the graphs (especially the font-based stuff) will likely get stretched in the final greplay image.
- Mark as New
- Bookmark
- Subscribe
- Mute
- RSS Feed
- Permalink
- Report Inappropriate Content
Yes, I did that.
Those images are generated using your code and I use them to show as an example
I only execute this code with the same pixels than the original (and goptions cback=white);:
proc greplay nofs igout=work.gseg tc=tempcat;
tdef custom des='Dashboard'
1/ llx=0 lly=0
ulx=0 uly=100
urx=100 ury=100
lrx=100 lry=0
;
template custom;
treplay
1:gege
des='' name="Output";
run;
As you can see, I only "copy and paste" the same grap but, when redraw the chart with GReplay the part wich is generated with GChart or GPlot grows a lot and I don´t know why.
I use your example to show the problem but I have the same problem with all the grapsh wich uses GReplay or GPlot.
Rob, I'm tryng to do something similar to your Example 26 of the book, and, individually, all graphs look ok, but when I assemble them only the GChart or GPlot got this problem. Pixels are Ok.
- Mark as New
- Bookmark
- Subscribe
- Mute
- RSS Feed
- Permalink
- Report Inappropriate Content
Can you post your entire SAS program?
I'd like to see what the xpixels/ypixels are when you create the individual graphs, and then what they are when you create the greplay.
- Mark as New
- Bookmark
- Subscribe
- Mute
- RSS Feed
- Permalink
- Report Inappropriate Content
%let name=infographic_template;
filename odsout '/ce/ANALYTICS/TEXT_MINING/SAS_DATA';
/*
SAS/Graph imitation of:
http://2.s3.envato.com/files/5879345/PreviewImage_Infographic.jpg
*/
data bar_data;
input barnum barval;
datalines;
1 .10
2 .20
3 .30
4 .40
5 .50
6 .60
7 .70
8 .80
;
run;
data bar_data; set bar_data;
length my_html $300;
my_html=
'title='||quote(trim(left(put(barval,percent5.0))))||
' href="infographic_template_info.htm"';
run;
data bar_anno; set bar_data;
xsys='2'; ysys='2'; when='a'; hsys='3';
function='label'; position='2'; color='cxf64f25';
midpoint=barnum; y=barval-.015;
style='arial narrow/bold'; size=5.2;
text=put(barval,percent5.0);
run;
data anno_stuff;
length function color $8 style $35 text $100;
xsys='3'; ysys='3'; hsys='3'; when='a';
/* title banner */
function='poly'; style='solid'; color='cx215b4d';
x=0; y=74; output;
function='polycont';
x=98; output;
x=x-4; y=y+9; output;
x=x+4; y=y+9; output;
x=0; output;
function='poly'; style='solid'; color='cx72c0b2';
x=0; y=74+3; output;
function='polycont';
x=98-3; output;
x=x-4; y=y+9; output;
x=x+4; y=y+9; output;
x=0; output;
function='label'; position='6'; color='cxe7e2d0';
style='gill sans mt condensed'; size=16;
x=3.0; y=89.5; text='INFOGRAPHIC DATA VISUALIZATION';
output;
/* smaller sub-title banner */
function='poly'; style='solid'; size=.; color='cx8e1608';
x=40; y=50; output;
function='polycont';
x=75; output;
x=x-1; y=y+5; output;
x=x+1; y=y+5; output;
x=40; output;
function='poly'; style='solid'; color='cxef5121';
x=40; y=50+1.5; output;
function='polycont';
x=75-1.5; output;
x=x-1; y=y+5; output;
x=x+1; y=y+5; output;
x=40; output;
function='label'; position='6'; color='cxe7e2d0';
style='tw cen mt condensed/bold'; size=6.0;
x=43.0; y=57.5; text='CITY NAME AND STATISTIC';
output;
/* circle/pointer at left end of small banner */
function='poly'; size=.001; /*rotate=.; angle=.;*/ style='solid'; color='cxef5121';
x=39; y=58.5; output;
function='polycont';
x=x-3.5; output;
x=x+3.5; y=y-13; output;
x=x+3.5; y=y+13; output;
x=39; y=58.5;
function='pie'; rotate=360;
size=7; color='cxef5121';
style='psolid'; output;
style='pempty'; output;
size=4.5; color='cxebe6d3';
style='psolid'; output;
style='pempty'; output;
function='pie';
/* big pie */
style='psolid';
x=16; y=41;
size=27;
color='cxef5121'; angle=0; rotate=360; output;
style='pempty'; output; /* extra outline, for smoothing */
style='psolid';
size=25;
color='cxebe6d3'; angle=90; rotate=(360/4); output;
color='cx72c0b2'; angle=180; rotate=(3*(360/4))/2; output;
/* smaller pie */
x=26; y=21;
size=17;
color='cx409985'; angle=0; rotate=360; output;
style='pempty'; output; /* extra outline, for smoothing */
style='psolid';
size=15.5;
color='cxef5121'; angle=90; rotate=(360/4); output;
color='cxebe6d3'; angle=180; rotate=(3*(360/4))/2; output;
/* stick-person in pie slice */
function='label'; rotate=0; angle=0; style='Webdings'; text='81'x; size=22; color='cxef5121';
x=6; y=57; output;
run;
goptions device=png;
goptions border;
goptions cback=cxe7e2d0;
goptions xpixels=885 ypixels=450;
ODS LISTING CLOSE;
ODS HTML path=odsout body="&name..htm"
(title="Infographic Template")
style=htmlblue;
goptions gunit=pct;
axis1 label=none value=none major=none minor=none style=0;
axis2 label=none value=none style=0;
pattern1 v=s c=cx72c0b2;
title1 h=35pct " ";
title2 h=60pct a=90 " ";
proc gchart data=bar_data anno=bar_anno;
vbar barnum / discrete type=sum sumvar=barval
raxis=axis1 maxis=axis2
width=4.25 space=4.5
noframe coutline=cxb5c1a3
anno=anno_stuff html=my_html
des='' name="gege";
run;
quit;
ODS HTML CLOSE;
ODS LISTING;
goptions display;
goptions xpixels=885 ypixels=450;
goptions cback=&fondo;
ODS LISTING CLOSE;
ODS HTML path=odsout body="&name..htm"
(title="APAC Digital Marketing Performance Dashboard Infographic (SAS/Graph version)")
style=htmlblue;
proc greplay nofs igout=work.gseg tc=tempcat;
tdef custom des='Dashboard'
1/ llx=0 lly=0
ulx=0 uly=100
urx=100 ury=100
lrx=100 lry=0
;
template custom;
treplay
1:gege
des='' name="Output";
run;
quit;
ods html close ;
ods listing ;
- Mark as New
- Bookmark
- Subscribe
- Mute
- RSS Feed
- Permalink
- Report Inappropriate Content
Since your final greplay is 885x450, and since you're placing your graph into a 'hole' that occupies the entire space (0-100), you will want to create your graph using 885x450 (which you are doing) ... ie, yes, it looks like your code is correct.
Is it possible that you are not replaying the grseg you think you are? For example, if you're running SAS in a DMS session, and you run a graph a 2nd time trying to use the same grseg name (gege), the 2nd/3rd/etc time you run it, SAS will append a number onto the grseg name. If you greplay 'gege' it will be from the first run (which maybe you had a different size xpixels/ypixels?) One way to test for this is to change a little bit of the text, and see if that text change shows up in your final greplay graph.
- Mark as New
- Bookmark
- Subscribe
- Mute
- RSS Feed
- Permalink
- Report Inappropriate Content
I already tested this and I tested again changing "gege" to "geges" and "output" to "outputs" and the same happend.
What I did before to "solve" this problem was to graph Bars using annotate and macro variables. Now I have a problem becouse I need to use "interpol=spline" and I don't want to program an interpol algorithm to solve this "size" problem.
I'm going to try to execute the same code using VI instead of guide...
- Mark as New
- Bookmark
- Subscribe
- Mute
- RSS Feed
- Permalink
- Report Inappropriate Content
Well, is a Guide "options" problem or something similar... in VI it works perfectly...
Original code:
Same graph in GReplay with VI:
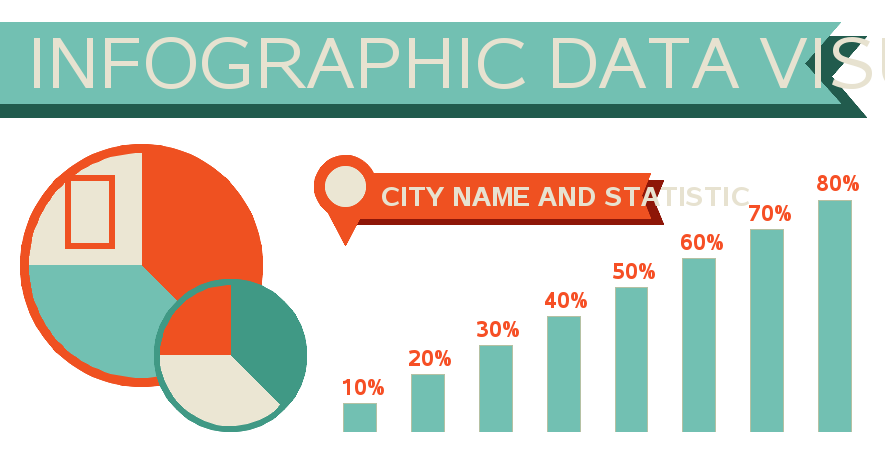
Wich option could be?
PD: I tried with "goptions reset=all;" but still the same result.
- Mark as New
- Bookmark
- Subscribe
- Mute
- RSS Feed
- Permalink
- Report Inappropriate Content
Hmm ... sounds like Enterprise Guide is overriding some of the things we're manually setting ![]()
Perhaps someone in the Enterprise Guide forum ( https://communities.sas.com/community/support-communities/sas_enterprise_guide), or Tech Support, might know how to overcome this EG behavior.
- Mark as New
- Bookmark
- Subscribe
- Mute
- RSS Feed
- Permalink
- Report Inappropriate Content
Yes... a real shame ![]() , specially for the lost hours hahaha.
, specially for the lost hours hahaha.
I'm not very VI friend... so I used this code in Guide:
X /sasbin/SAS/SASFoundation/9.3/sas /home/sassrv/prueba.sas -noterminal -work /saswork;
and it works perfectly to. It does the same as executing VI but I still can do it in Guide... isn't the best solution but is a solution...
.jpg")
Catch up on SAS Innovate 2026
Nearly 200 sessions are now available on demand in the Innovate Hub.
Watch Now →Learn how use the CAT functions in SAS to join values from multiple variables into a single value.

Find more tutorials on the SAS Users YouTube channel.
SAS Training: Just a Click Away
Ready to level-up your skills? Choose your own adventure.
-
9 replies
-
01-06-2014 11:27 AM
-
6119 views
-
6 likes
-
2 in conversation
-
