- Home
- /
- Programming
- /
- Graphics
- /
- Re: Polyline on a boxplot
- RSS Feed
- Mark Topic as New
- Mark Topic as Read
- Float this Topic for Current User
- Bookmark
- Subscribe
- Mute
- Printer Friendly Page

- Mark as New
- Bookmark
- Subscribe
- Mute
- RSS Feed
- Permalink
- Report Inappropriate Content
Hi
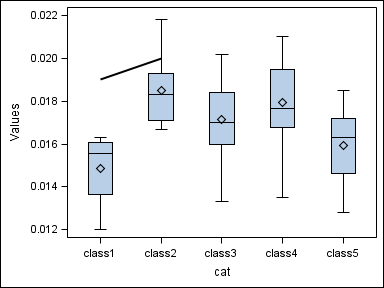
I want to add brackets and asterisks on a boxplot to highlight boxes that are significantly different.
I have tried the following annotate code:
data anno;
length xc1 $ 6;
retain drawspace "datavalue";
function="polyline";
y1=0.019;
xc1= "class1";
output;
y1=0.020;
output;
xc1="class2";
output;
y1=0.019;
output;
y1=0.020;
output;
run;
proc sgplot data= myData sganno=anno;
vbox values/category=categoy ;
run;
But no line is draw on the plot.
Can somebody can help me?

- Mark as New
- Bookmark
- Subscribe
- Mute
- RSS Feed
- Permalink
- Report Inappropriate Content
Please see documentation. After POLYLINE, you need one or morePOLYCONT function for the subsequent points. Also, it will be easier if you attach your data set.
- Mark as New
- Bookmark
- Subscribe
- Mute
- RSS Feed
- Permalink
- Report Inappropriate Content
Thank you for your answer.
I have tried to add POLYCONT function.
data anno;
length xc1 $ 15;
retain drawspace "datavalue";
function="polyline";
y1=0.019;
xc1= "class1";
output;
y1=0.020;
function="polycont";
output;
xc1="class2";
function="polycont";
output;
y1=0.019;
function="polycont";
output;
run;
But then I add the following warning "
WARNING: L'instruction DrawPolyline a des valeurs manquantes/incorrectes pour la position (X or Y). Instruction de tracé ignorée."
I attach the data
- Mark as New
- Bookmark
- Subscribe
- Mute
- RSS Feed
- Permalink
- Report Inappropriate Content
With cataqgory values, the XC1 value provided have to EXACTLY match the value on the axis. We will improve the matching at our end to make this easier. In the meantime, make sure your XC values are EXACTLY the same as the values on the axis.
proc import datafile='C:\Soso_data.xls'
dbms=XLS out=myData replace;
run;
data mydata2;
length cat $6;
set mydata;
cat=category;
run;
data anno;
length xc1 $6;
retain drawspace "datavalue";
function="polyline";
y1=0.019;
xc1= "class1";
output;
function="polycont";
y1=0.020;
xc1="class2";
output;
run;
ods listing;
proc sgplot data= myData2 sganno=anno;
vbox values/category=cat ;
run;
- Mark as New
- Bookmark
- Subscribe
- Mute
- RSS Feed
- Permalink
- Report Inappropriate Content
Thank you very much.
It works perfectly.
.jpg")
Catch up on SAS Innovate 2026
Nearly 200 sessions are now available on demand in the Innovate Hub.
Watch Now →Learn how use the CAT functions in SAS to join values from multiple variables into a single value.

Find more tutorials on the SAS Users YouTube channel.
SAS Training: Just a Click Away
Ready to level-up your skills? Choose your own adventure.
-
4 replies
-
04-08-2013 10:58 AM
-
3667 views
-
3 likes
-
2 in conversation
-
