- Home
- /
- Programming
- /
- Graphics
- /
- Plotting two variables on one graph
- RSS Feed
- Mark Topic as New
- Mark Topic as Read
- Float this Topic for Current User
- Bookmark
- Subscribe
- Mute
- Printer Friendly Page


- Mark as New
- Bookmark
- Subscribe
- Mute
- RSS Feed
- Permalink
- Report Inappropriate Content
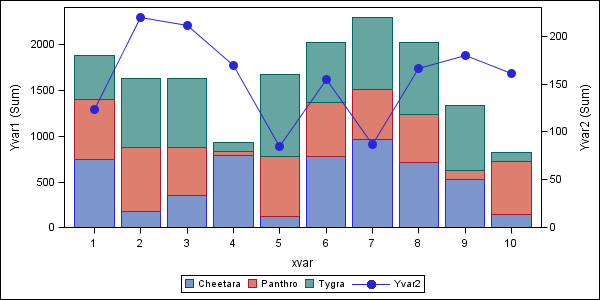
I'm looking to plot two separate variables on the same bar graph. I am currently using proc gbarline to plot one of the variables, but I'd like another to be displayed next to it as another bar (not a line - essentially another "sumvar" statement). Is this possible, or is there another way/procedure that will perform this? Thanks!
- Mark as New
- Bookmark
- Subscribe
- Mute
- RSS Feed
- Permalink
- Report Inappropriate Content
FYI - The data is complicated enough that I am also plotting by subgroups and it cannot be transposed to create just one variable to graph.


- Mark as New
- Bookmark
- Subscribe
- Mute
- RSS Feed
- Permalink
- Report Inappropriate Content
If you have SAS 9.2 or higher, you can do this using GTL. Here is an example from a previous post. Please post your graph and data so I can send you something closer to what you want.

- Mark as New
- Bookmark
- Subscribe
- Mute
- RSS Feed
- Permalink
- Report Inappropriate Content
Gbarline supports subgrouped bars (stacked segments), but not grouped bars (side-by-side).
One possible work-around is to use Gchart to create the bar chart, and then use annotate
to draw the line. Here's an example:
- Mark as New
- Bookmark
- Subscribe
- Mute
- RSS Feed
- Permalink
- Report Inappropriate Content
Thank you for the information, but it's not quite what I'm looking for. I'm not actually wanting to put a line on the bar graph, I'm wanting to just make a bar graph that looks like the one you just posted (without the line) - but with two different variables. I do not have a "type" that both the variables I want to plot are under; they are each their own and must be plotted separately. Because I also need to plot by subgroups, transposing the data to put them under one heading is not possible. Can I simply combine two different bar graphs?
- Mark as New
- Bookmark
- Subscribe
- Mute
- RSS Feed
- Permalink
- Report Inappropriate Content
Hmm ... well, if you don't want a line, then you definitely don't want to be using Proc GBarline 
You can combine 2 bar charts with Proc GReplay ... but I don't think the results would be what you're wanting.
Could you possibly post up some example data?
And, better yet, maybe "draw" a picture of the graph you're wanting (scan in a hand-drawn graph, or use a drawing package, or something) to show us what you're wanting?
- Mark as New
- Bookmark
- Subscribe
- Mute
- RSS Feed
- Permalink
- Report Inappropriate Content
Which release of SAS are you using? With SAS 9.2, you can easily combine multiple bar charts in one graph using GTL, with or without the line.

Call for content now open!
It's your turn to help shape SAS Innovate 2027. Share your expertise and inspire the SAS community.
Learn how use the CAT functions in SAS to join values from multiple variables into a single value.

Find more tutorials on the SAS Users YouTube channel.
SAS Training: Just a Click Away
Ready to level-up your skills? Choose your own adventure.
-
6 replies
-
11-10-2011 05:16 PM
-
5933 views
-
0 likes
-
3 in conversation
-


