- Home
- /
- Programming
- /
- Graphics
- /
- PROC SGPLOT creates too much blank space
- RSS Feed
- Mark Topic as New
- Mark Topic as Read
- Float this Topic for Current User
- Bookmark
- Subscribe
- Mute
- Printer Friendly Page

- Mark as New
- Bookmark
- Subscribe
- Mute
- RSS Feed
- Permalink
- Report Inappropriate Content
I'm trying to create box plots with PROC SGPLOT, but I end up with way too much blank gray space at the bottom of the graphs (where the legend usually goes). Does anyone know how to fix this so that the "empty" space doesn't take up so much room and the graph itself can be larger? This is my code:
%MACRO boxplots (compound=);
DATA final2;
SET final;
label concentration="uM";
RUN;
proc sgplot data=final2 dattrmap=attrmap noautolegend;
title "&compound.";
vbox concentration / category=group group=group attrid=group;
where compound="&compound.";
xaxis label=" ";
run;
title " ";
%MEND boxplots;
data attrmap;
input id $ value $7. @15 fillcolor $10. linecolor $8.;
datalines;
group RT white black
group BR LTGRAY black
;
run;
proc template;
define style myfont;
parent=styles.default;
style GraphFonts /
'GraphDataFont' = ("Arial",28pt,bold)
'GraphUnicodeFont' = ("Arial",28pt,bold)
'GraphValueFont' = ("Arial",28pt,bold)
'GraphLabelFont' = ("Arial",28pt,bold)
'GraphFootnoteFont' = ("Arial",28pt,bold)
'GraphTitleFont' = ("Arial",28pt,bold)
'GraphAnnoFont' = ("Arial",28pt,bold);
end;
run;
ods graphics on;
ods rtf file="XXXXXXXXXXXXXXXXXXXX" style=myfont;
%boxplots (compound=2-Oxoisocaproate);
%boxplots (compound=3-Hydroxybutyrate);
%boxplots (compound=3-Hydroxyisovalerate);
ods rtf close;
Accepted Solutions

- Mark as New
- Bookmark
- Subscribe
- Mute
- RSS Feed
- Permalink
- Report Inappropriate Content
You have x axis label=' '. This leaves a blank space for the label. To remove the xaxis label use XAXIS DISPLAY=(NOLABEL);.

- Mark as New
- Bookmark
- Subscribe
- Mute
- RSS Feed
- Permalink
- Report Inappropriate Content
Two questions:
1. What version of SAS are you running?
2. Since we do not have the data, can you attach a picture that demonstrates the issue?
Thanks!
Dan
- Mark as New
- Bookmark
- Subscribe
- Mute
- RSS Feed
- Permalink
- Report Inappropriate Content
Sure! I'm running SAS 9.4. Here's one of the graphs:
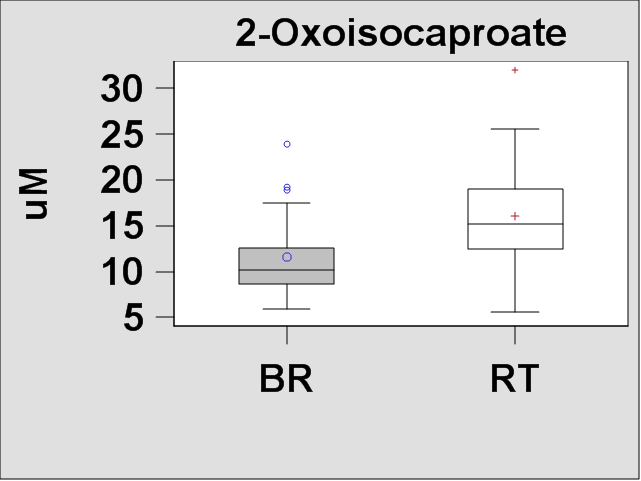
Thank you!
- Mark as New
- Bookmark
- Subscribe
- Mute
- RSS Feed
- Permalink
- Report Inappropriate Content
You have x axis label=' '. This leaves a blank space for the label. To remove the xaxis label use XAXIS DISPLAY=(NOLABEL);.
- Mark as New
- Bookmark
- Subscribe
- Mute
- RSS Feed
- Permalink
- Report Inappropriate Content
That worked! Thank you so much!
.jpg")
Catch up on SAS Innovate 2026
Nearly 200 sessions are now available on demand in the Innovate Hub.
Watch Now →Learn how use the CAT functions in SAS to join values from multiple variables into a single value.

Find more tutorials on the SAS Users YouTube channel.
SAS Training: Just a Click Away
Ready to level-up your skills? Choose your own adventure.
-
4 replies
-
05-26-2015 10:28 AM
-
5716 views
-
0 likes
-
3 in conversation
-
