- Home
- /
- Programming
- /
- Graphics
- /
- Overlay State County Map
- RSS Feed
- Mark Topic as New
- Mark Topic as Read
- Float this Topic for Current User
- Bookmark
- Subscribe
- Mute
- Printer Friendly Page

- Mark as New
- Bookmark
- Subscribe
- Mute
- RSS Feed
- Permalink
- Report Inappropriate Content
I'm a real newbie to Proc Gmap but I managed to create a color-coded zip-code level map of Virginia using the paper by Barbara Okerson. Now I want to overlay a county level map. What is the best way to do this?
Thanks,
Brian

- Mark as New
- Bookmark
- Subscribe
- Mute
- RSS Feed
- Permalink
- Report Inappropriate Content
Hi BTA,
This must be destiny, because I was creating an example that overlays a county outline onto a zipcode map, just yesterday! ![]() Here is a link to the output, and the SAS code:
Here is a link to the output, and the SAS code:
http://robslink.com/SAS/democd69/wake_county_demographics.htm
http://robslink.com/SAS/democd69/wake_county_demographics_info.htm
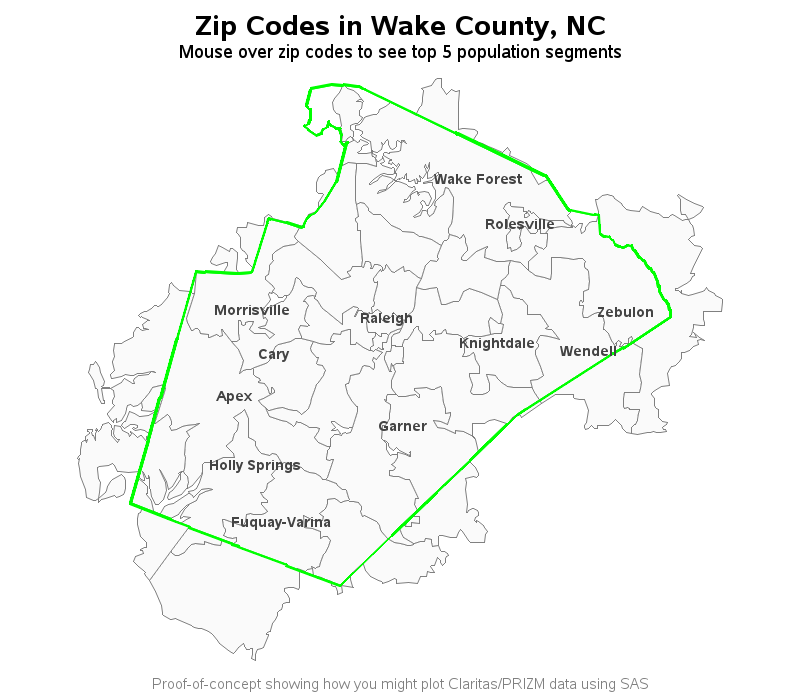
Basically, you let gmap draw the zipcode map, and then use 'annotate' to draw the extra level of borders (such as county or state outlines). There are 2 techniques for creating the annotate outlines (that I've seen) ... the simpler technique assigns the annotate 'poly' function to the first data-point of each area's outline, and then annotate 'polycont' function to the other data-points of the areas. A slightly more complex algorithm using annotate 'move' & 'draw' has a slightly more complex algorithm, and handles complex maps with 'holes' and such in it.
When using this technique, you need to make sure that your zipcode map, and the map you're going to use for the annotated border are both in the same units (lat/long in degrees or radians, and the longitude has to be in eastlong or westlong). Once they're in the same coordinate system, combine them and Proc Gproject them together.
This is described in more detail in Example 12 in my book SAS/Graph: Beyond the Basics, using the following example (which annotates a state border onto a county map):
- Mark as New
- Bookmark
- Subscribe
- Mute
- RSS Feed
- Permalink
- Report Inappropriate Content
Robert,
Thank you so much. That is excatly the kind of thing I'm looking for. I've been playing around trying to incorporate some of your code into mine but when I run the gmap proc I get a mess of error messages about the X Y coordinates not being in range. I suspect it has something to do with proc gproject, with which I am totally unfamiliar. But I'll keep plugging away!
Thanks again!
.jpg")
Catch up on SAS Innovate 2026
Nearly 200 sessions are now available on demand in the Innovate Hub.
Watch Now →Learn how use the CAT functions in SAS to join values from multiple variables into a single value.

Find more tutorials on the SAS Users YouTube channel.
SAS Training: Just a Click Away
Ready to level-up your skills? Choose your own adventure.
-
2 replies
-
01-21-2014 08:16 PM
-
4958 views
-
1 like
-
2 in conversation
-
