- Home
- /
- Programming
- /
- Graphics
- /
- Order xaxis by descending frequency in sgplot
- RSS Feed
- Mark Topic as New
- Mark Topic as Read
- Float this Topic for Current User
- Bookmark
- Subscribe
- Mute
- Printer Friendly Page
- Mark as New
- Bookmark
- Subscribe
- Mute
- RSS Feed
- Permalink
- Report Inappropriate Content
I have some data on adverse events that I'd like to show in sgplot. I want the xaxis to be ordered by descending frequency.
When I use the CATEGORYORDER=RESPDESC it works. However, when I want to group the vbar this option is ignored.
proc sgplot data=AE_data;
vbar site_ID / CATEGORYORDER=RESPDESC group=severity ;
run;
I do not want to use discreteorder=data because this will order the data by Site_ID, not by the frequency of site_id. How do I get an output with the vbar sorted by frequency of site_id?
Accepted Solutions
- Mark as New
- Bookmark
- Subscribe
- Mute
- RSS Feed
- Permalink
- Report Inappropriate Content
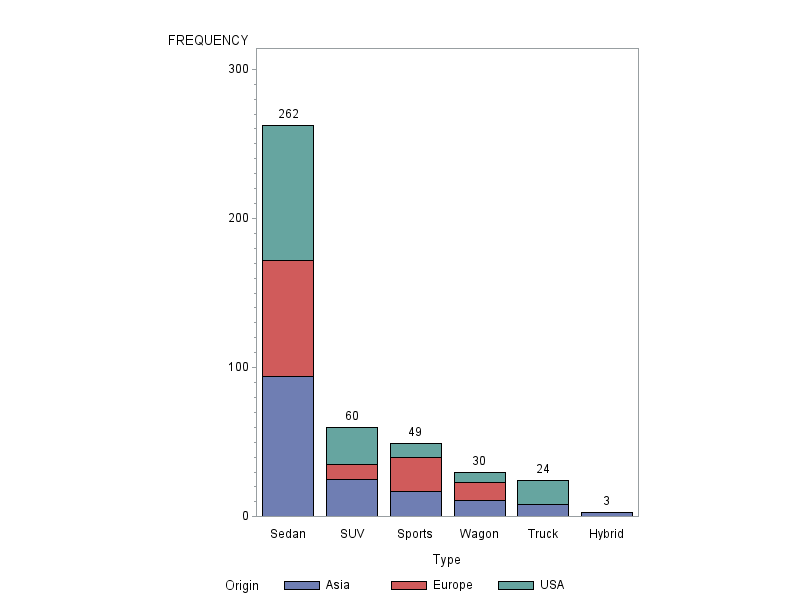
If sgplot can't easily create the chart you want, perhaps Proc Gchart would be a better choice?...
proc gchart data=sashelp.cars;
vbar type / type=freq outside=freq subgroup=origin descending;
run;

- Mark as New
- Bookmark
- Subscribe
- Mute
- RSS Feed
- Permalink
- Report Inappropriate Content
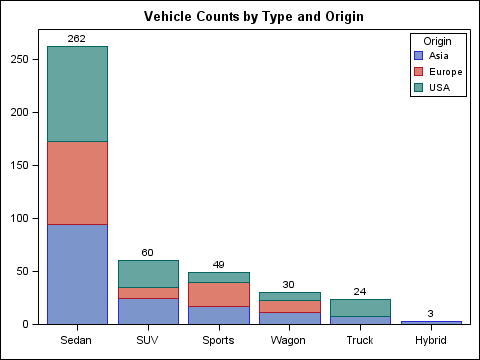
Yes, I see the problem. When GROUP is specified, you are getting group order of descending response, but discrete order of ascending (default). This is a bug we will need to addess.
The way out I see is to summarize the data using proc means, sort by descending (sum of) frequencies and then use VBAR to draw the data with N as the response variable and DiscreteOrder=Data. Here is an example.

- Mark as New
- Bookmark
- Subscribe
- Mute
- RSS Feed
- Permalink
- Report Inappropriate Content
Thanks Sanjay. Because the data are character, I ran a PROC FREQ on the site_id, output those counts to a dataset, and merged this new freq dataset with the original dataset. Then I sorted on frequency before plotting. Is there an easier/smarter way to obtain frequencies without merging the output and original datasets? I have multiple variables that I need to graph and then plot by descending frequency in this dataset. Therefore, I'm running several frequencies and outputing to multiple datasets and then merging these datasets with the original.
- Mark as New
- Bookmark
- Subscribe
- Mute
- RSS Feed
- Permalink
- Report Inappropriate Content
I did it a little differently. My code is attached. Only issue in this case is that the segments within the bars are not correctly sorted in descending order due to another bug in SGPLOT. :smileyplain: But, if you don't care about that, you are good to go. If you do care about it, then you need another adjustment.
- Mark as New
- Bookmark
- Subscribe
- Mute
- RSS Feed
- Permalink
- Report Inappropriate Content
If sgplot can't easily create the chart you want, perhaps Proc Gchart would be a better choice?...
proc gchart data=sashelp.cars;
vbar type / type=freq outside=freq subgroup=origin descending;
run;

- Mark as New
- Bookmark
- Subscribe
- Mute
- RSS Feed
- Permalink
- Report Inappropriate Content
Yes, that's much easier. Using SGPLOT, I have to create frequency datasets, merge those datasets with the original, and then plot.
April 27 – 30 | Gaylord Texan | Grapevine, Texas
Registration is open
Walk in ready to learn. Walk out ready to deliver. This is the data and AI conference you can't afford to miss.
Register now and save with the early bird rate—just $795!
Learn how use the CAT functions in SAS to join values from multiple variables into a single value.
Find more tutorials on the SAS Users YouTube channel.
SAS Training: Just a Click Away
Ready to level-up your skills? Choose your own adventure.


