- Home
- /
- Programming
- /
- Graphics
- /
- Re: ODS HTML- screen resolution
- RSS Feed
- Mark Topic as New
- Mark Topic as Read
- Float this Topic for Current User
- Bookmark
- Subscribe
- Mute
- Printer Friendly Page

- Mark as New
- Bookmark
- Subscribe
- Mute
- RSS Feed
- Permalink
- Report Inappropriate Content
Hello,
I'm using ODS html to produce completely static html reports ( text/tables/images) that a manager access through a link ( sample link )
The problem is that each manager uses a different laptop/desktop screen size/resolution and what happens is that on smaller sizes/resolution the report tends to badly overflow the screen edges
Any idea for a non expert related web issues?
Thanks
Abe
Accepted Solutions

- Mark as New
- Bookmark
- Subscribe
- Mute
- RSS Feed
- Permalink
- Report Inappropriate Content
I'm not sure of your SAS version, but a great solution for your situation is to generate the output as SVG in the HTML page instead of an image. That way, the contents will resize to the size of the browser container. Here is a simple example for you to try:
ods html file="test.html";
ods graphics / imagefmt=svg;
proc sgplot data=sashelp.class;
vbar age;
run;
ods html close;
Hope this helps!
Dan

- Mark as New
- Bookmark
- Subscribe
- Mute
- RSS Feed
- Permalink
- Report Inappropriate Content
With SAS/Graph, the only 2 solutions I see are ...
1) Create the graphs so they will fit on the smallest screen.
2) Create multiple versions of the reports, to accommodate different screen sizes.

- Mark as New
- Bookmark
- Subscribe
- Mute
- RSS Feed
- Permalink
- Report Inappropriate Content
Would another export format such as PDF or RTF be acceptable? Those folks should be used to viewing other files than html that don't try to scale as much auotmatically.
- Mark as New
- Bookmark
- Subscribe
- Mute
- RSS Feed
- Permalink
- Report Inappropriate Content
No. The ask for html
Abe
- Mark as New
- Bookmark
- Subscribe
- Mute
- RSS Feed
- Permalink
- Report Inappropriate Content
I'm not sure of your SAS version, but a great solution for your situation is to generate the output as SVG in the HTML page instead of an image. That way, the contents will resize to the size of the browser container. Here is a simple example for you to try:
ods html file="test.html";
ods graphics / imagefmt=svg;
proc sgplot data=sashelp.class;
vbar age;
run;
ods html close;
Hope this helps!
Dan
- Mark as New
- Bookmark
- Subscribe
- Mute
- RSS Feed
- Permalink
- Report Inappropriate Content
Extremely promising! Thanks
- Mark as New
- Bookmark
- Subscribe
- Mute
- RSS Feed
- Permalink
- Report Inappropriate Content
Hi,
I am facing an issue with the svg format. Axis seems to start always at 0 no mater the min and max axis statement (sgplot); For many situations , it is not practical. Any idea?
Thanks again
Abe
- Mark as New
- Bookmark
- Subscribe
- Mute
- RSS Feed
- Permalink
- Report Inappropriate Content
This is not a function of svg -- it is probably just a minor coding issue. Can you send a snippet of code showing the graph you are trying to create?
Thanks!
Dan
- Mark as New
- Bookmark
- Subscribe
- Mute
- RSS Feed
- Permalink
- Report Inappropriate Content
Here it is. Thanks!
ODS GRAPHICS / RESET IMAGENAME = 'eee106' IMAGEFMT =svg noborder ;
ods html file="eee106.html" path="C:\" gpath="C:\Graphs" (url="Graphs/") nogtitle style=normal ;
proc sgplot data=IndicAvgVsOthers ;
hbar itemName/ STAT= mean group=entity response=score groupdisplay=cluster DATALABEL transparency=0.1 nooutline ;
xaxis MAX= 5 MIN=2 grid display=(nolabel ) grid;
keylegend / title='';
format score 5.2;
yaxis display=(nolabel noticks) discreteorder=data valueattrs=(size=11) grid;
run;
ods html close;

- Mark as New
- Bookmark
- Subscribe
- Mute
- RSS Feed
- Permalink
- Report Inappropriate Content
It is harder to diagnose without some data. The code wants to find good round numbers for the axis. Adding a XAXIS VALUES option that includes your min and max values and other values helped with sashelp.cars.
- Mark as New
- Bookmark
- Subscribe
- Mute
- RSS Feed
- Permalink
- Report Inappropriate Content
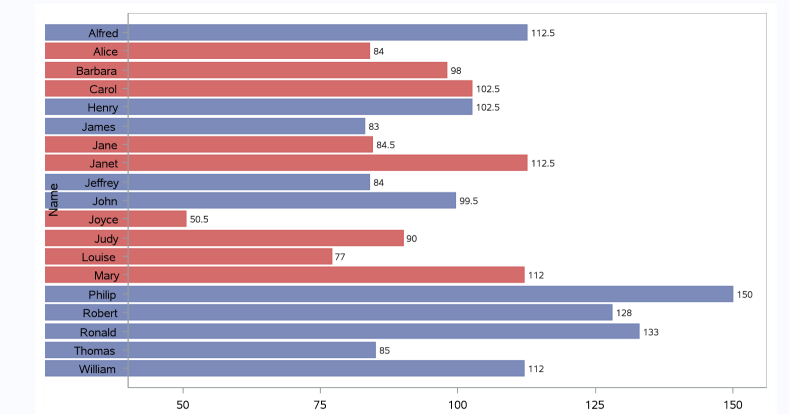
I've tried also with sashelp.class but continue to get the below image
ods html file="c:/test.html" gpath="c:/graphs";
ods graphics / imagefmt=svg;
proc sgplot data=sashelp.class;
hbar name/ STAT= mean group=sex response=Weight groupdisplay=cluster DATALABEL transparency=0.1 nooutline name="MYCHART" barwidth=1;
xaxis min=40;
proc print data=sashelp.class;;
run;
ods html close;
- Mark as New
- Bookmark
- Subscribe
- Mute
- RSS Feed
- Permalink
- Report Inappropriate Content
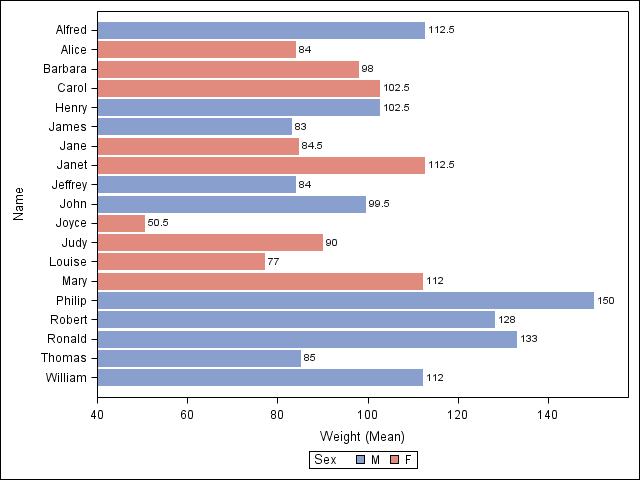
This is correct. X axis min is 40. There is no tick and value at '40' because the computed tick interval is 25. You can change that by setting the VALUES option. Note VALUESHINT option.
hbar name/ STAT= mean group=sex response=Weight
groupdisplay=cluster DATALABEL transparency=0.1 nooutline barwidth=1;
xaxis min=40 values=(40 to 150 by 20) valueshint;
run;
 proc sgplot data=sashelp.class;
- Mark as New
- Bookmark
- Subscribe
- Mute
- RSS Feed
- Permalink
- Report Inappropriate Content
I use your code but continue to get the incorrect chart on sas 9.3
Any clue?
Abe
- Mark as New
- Bookmark
- Subscribe
- Mute
- RSS Feed
- Permalink
- Report Inappropriate Content
I just used your code and changed the XAXIS statement. Also, the image you attached has a weird bar color extending to underneath the tick values on the Y axis. I don't know what is causing that. It is easier to help if you include your full program with code and data.

- Mark as New
- Bookmark
- Subscribe
- Mute
- RSS Feed
- Permalink
- Report Inappropriate Content
That code worked for me on SAS 9.3 on Unix. I took out the PROC PRINT but added a RUN to close the PROC SGPLOT.
What browser are you using?
.jpg")
Catch up on SAS Innovate 2026
Nearly 200 sessions are now available on demand in the Innovate Hub.
Watch Now →Learn how use the CAT functions in SAS to join values from multiple variables into a single value.

Find more tutorials on the SAS Users YouTube channel.
SAS Training: Just a Click Away
Ready to level-up your skills? Choose your own adventure.
-
14 replies
-
08-22-2013 03:42 AM
-
8823 views
-
6 likes
-
6 in conversation
-
