- Home
- /
- Programming
- /
- Graphics
- /
- KM plot. use vertical line as symbol
- RSS Feed
- Mark Topic as New
- Mark Topic as Read
- Float this Topic for Current User
- Bookmark
- Subscribe
- Mute
- Printer Friendly Page

- Mark as New
- Bookmark
- Subscribe
- Mute
- RSS Feed
- Permalink
- Report Inappropriate Content
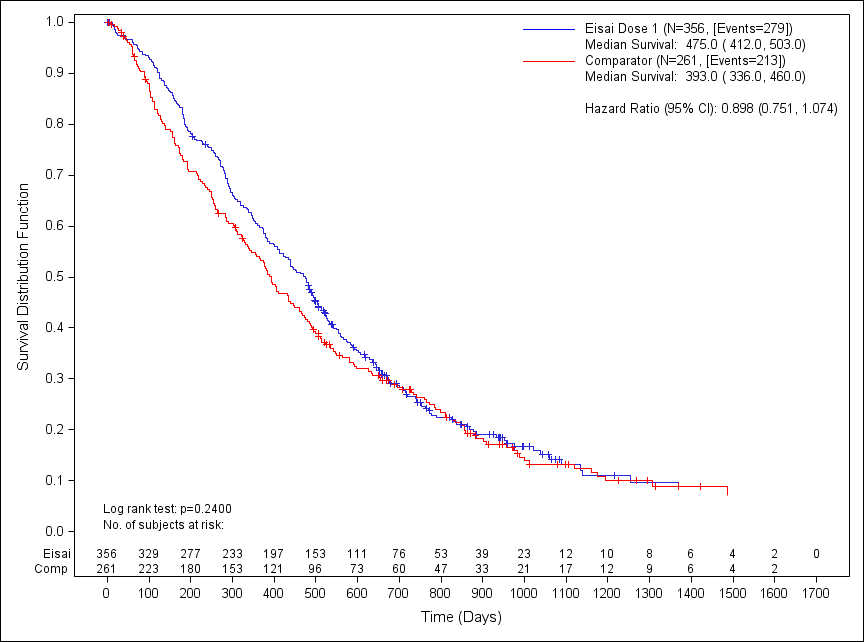
as is traditional in a KM plot (step plot) the symbol for a censored value is a ¦ (vertical line). every example Ive seen in GTL uses a symbol of plus as there doesnt seem to be an appropriate symbol and unlike old versions I cant use a capital i. My example below uses a + too and it doesnt look quite right.
stepplot x=_x y=_surv / group=signvar lineattrs=(pattern=solid) name='s';
scatterplot x=_x y=_cens / markerattrs=(symbol=plus) GROUP=signvar ;

- Mark as New
- Bookmark
- Subscribe
- Mute
- RSS Feed
- Permalink
- Report Inappropriate Content
You have two option. With SAS 9.4M1, you can use any character from a font as a symbol using the SYMBOLCHAR statement. With Unicode fonts, your choices are huge. Pre SAS 9.4M1, you can use the SCATTERPLOT with MARKERCHARACTER option to draw the vertical bar "|" at each location.

- Mark as New
- Bookmark
- Subscribe
- Mute
- RSS Feed
- Permalink
- Report Inappropriate Content
Sanjay,
Thank you for coming and the autograph. Great talk in BUG. Hope you had a pleasant trip!
Haikuo
- Mark as New
- Bookmark
- Subscribe
- Mute
- RSS Feed
- Permalink
- Report Inappropriate Content
It was my pleasure meeting all the BUGS attendees.
- Mark as New
- Bookmark
- Subscribe
- Mute
- RSS Feed
- Permalink
- Report Inappropriate Content
Hi Sanjay
Im using 9.3 and using the scatterplot/markerchar. however it doesnt give me the option to use a vertical bar "|", only the ones in the standard ones.
unless Im doing something wrong with my scatter?
scatterplot x=_x y=_cens / markerattrs=(symbol=plus) GROUP=signvar ;
Thanks
Adie
- Mark as New
- Bookmark
- Subscribe
- Mute
- RSS Feed
- Permalink
- Report Inappropriate Content
after all this...my boss has changed his mind and the "plus" is now acceptable!
Thanks anyway!
- Mark as New
- Bookmark
- Subscribe
- Mute
- RSS Feed
- Permalink
- Report Inappropriate Content
OK. But if you still need to do something similar later, here is what you do. First, add a new column (censor) to your data and populate it with the character(s) you want to display in the graph.. In this case, put a "|" where ever you want the display the censor observation. Then use the scatterplot with same X and Y variables and the option markercharacter=censor. Keep the length of this variable (or format) as small as possible to avoid any leading blanks.
.jpg")
Catch up on SAS Innovate 2026
Nearly 200 sessions are now available on demand in the Innovate Hub.
Watch Now →Learn how use the CAT functions in SAS to join values from multiple variables into a single value.

Find more tutorials on the SAS Users YouTube channel.
SAS Training: Just a Click Away
Ready to level-up your skills? Choose your own adventure.
-
6 replies
-
07-22-2014 11:50 AM
-
5110 views
-
0 likes
-
3 in conversation
-
