- Home
- /
- Programming
- /
- Graphics
- /
- Re: Is there any way we can combine Clustered Sub Group - Bar Graph an...
- RSS Feed
- Mark Topic as New
- Mark Topic as Read
- Float this Topic for Current User
- Bookmark
- Subscribe
- Mute
- Printer Friendly Page

- Mark as New
- Bookmark
- Subscribe
- Mute
- RSS Feed
- Permalink
- Report Inappropriate Content
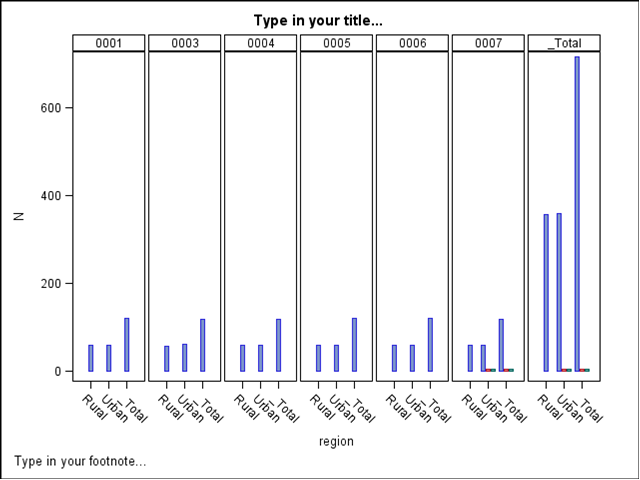
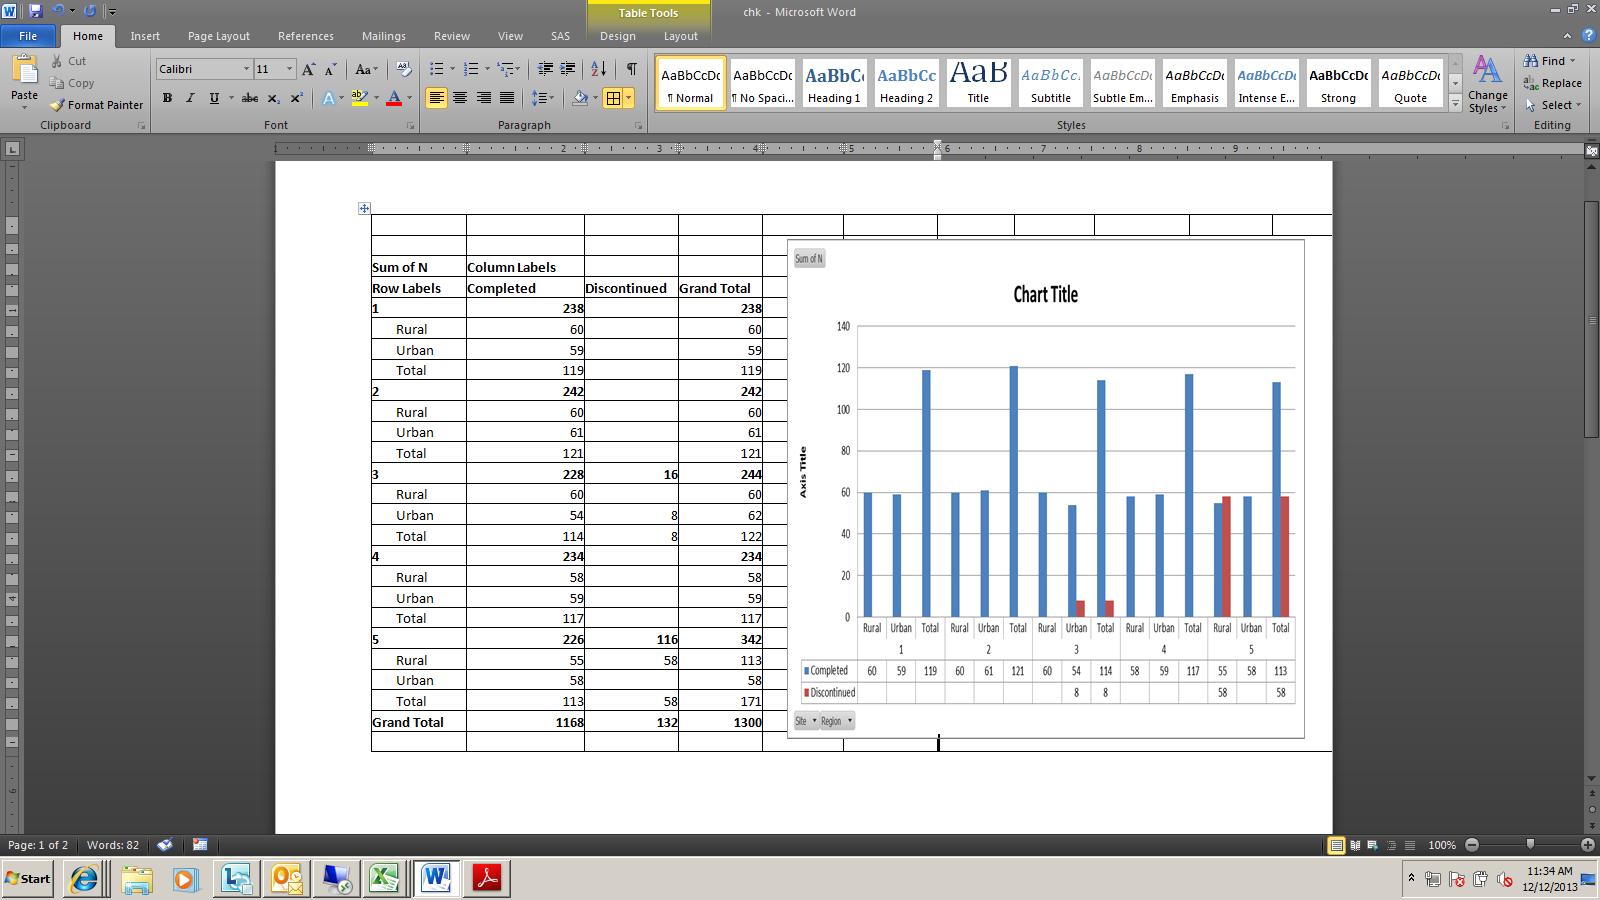
What i need is in similar way in excel, we can club bar chart with datatable. The same structure we can do with proc template --> and layouts but sub group will not able to create. Can any one suggest me on this?

- Mark as New
- Bookmark
- Subscribe
- Mute
- RSS Feed
- Permalink
- Report Inappropriate Content
You can use the idea shown in this article. Just replace the scatter / series plot with a bar chart. If you have SAS 9.3, you can use GROUPDISPLAY=CLUSTER.
- Mark as New
- Bookmark
- Subscribe
- Mute
- RSS Feed
- Permalink
- Report Inappropriate Content
Hi Sanjay, Thanks for your replay. However, there is a limitation has been found that, subgroup option cannot be used when we have datatable in PROC TEMPLATE.
- Mark as New
- Bookmark
- Subscribe
- Mute
- RSS Feed
- Permalink
- Report Inappropriate Content
Please attach your program with data so it is easier to see what you are doing.
- Mark as New
- Bookmark
- Subscribe
- Mute
- RSS Feed
- Permalink
- Report Inappropriate Content
.jpg")
Catch up on SAS Innovate 2026
Nearly 200 sessions are now available on demand with the SAS Innovate Digital Pass.
Explore Now →Learn how use the CAT functions in SAS to join values from multiple variables into a single value.

Find more tutorials on the SAS Users YouTube channel.
SAS Training: Just a Click Away
Ready to level-up your skills? Choose your own adventure.
-
4 replies
-
12-11-2013 07:47 AM
-
2613 views
-
0 likes
-
2 in conversation
-
