- Home
- /
- Programming
- /
- Graphics
- /
- Is there a way to convert freq sgplot to % while keeping freq labels?
- RSS Feed
- Mark Topic as New
- Mark Topic as Read
- Float this Topic for Current User
- Bookmark
- Subscribe
- Mute
- Printer Friendly Page

- Mark as New
- Bookmark
- Subscribe
- Mute
- RSS Feed
- Permalink
- Report Inappropriate Content
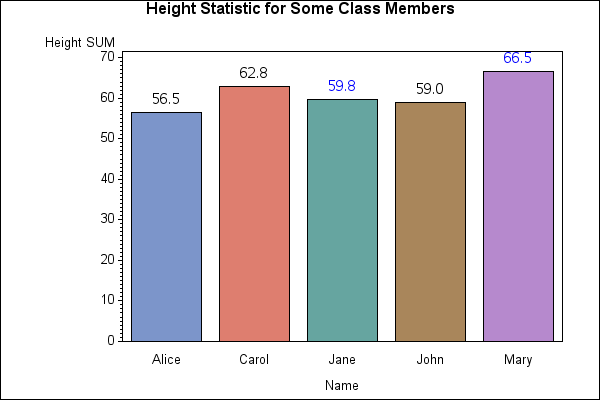
I have something like attached. Is there a way to change the y axis to % while keeping the annotated actual count above the bars? (i.e. change response to pct but the 56.5, 62.8 etc above the bars?)

- Mark as New
- Bookmark
- Subscribe
- Mute
- RSS Feed
- Permalink
- Report Inappropriate Content
Percent of what? I don't understand how this applies to heights.
Paige Miller
- Mark as New
- Bookmark
- Subscribe
- Mute
- RSS Feed
- Permalink
- Report Inappropriate Content
crude example, shouldn't have used heights... just used it as the visualization. pretend it is count data. Want % each bar contributes to the total count (if the heights were counts)
- Mark as New
- Bookmark
- Subscribe
- Mute
- RSS Feed
- Permalink
- Report Inappropriate Content

- Mark as New
- Bookmark
- Subscribe
- Mute
- RSS Feed
- Permalink
- Report Inappropriate Content
I think you need to pre-summarize the data so that the input data contains a Count for each category. Then you can use STAT=PCT to set the Y axis and use DATALABEL=Count to specify the bar labels:
/* create bar chart of counts by age */
proc means data=sashelp.class;
class age;
var height;
output out=ClassSummary N=Count;
run;

proc sgplot data=ClassSummary;
vbar age / freq=Count stat=pct datalabel=Count;
run;
.jpg")
Catch up on SAS Innovate 2026
Nearly 200 sessions are now available on demand with the SAS Innovate Digital Pass.
Explore Now →Learn how use the CAT functions in SAS to join values from multiple variables into a single value.

Find more tutorials on the SAS Users YouTube channel.
SAS Training: Just a Click Away
Ready to level-up your skills? Choose your own adventure.
-
4 replies
-
02-09-2020 03:42 PM
-
2706 views
-
2 likes
-
3 in conversation
-
