- Home
- /
- Programming
- /
- Graphics
- /
- Re: In respect to SGPLOT VBAR
- RSS Feed
- Mark Topic as New
- Mark Topic as Read
- Float this Topic for Current User
- Bookmark
- Subscribe
- Mute
- Printer Friendly Page
- Mark as New
- Bookmark
- Subscribe
- Mute
- RSS Feed
- Permalink
- Report Inappropriate Content
Hi everyone,
I am having issue with vbar statement of Proc SGPLOT. Here is data.
A room:
case 1 from 2018/1/1 8:00 am to 2018/1/1 9:30 am
case 2 from 2018/1/1 9:50 am to 2018/1/1 10:20 am
case 3 from 2018/1/1 10:50 am to 2018/1/1 2:50 pm
B room:
case 1 from 2018/1/1 8:45 am to 2018/1/1 11:20 am
case 2 from 2018/1/1 11:55 am to 2018/1/1 4:20 pm
Please help to get the plot. Thank you.
Accepted Solutions
- Mark as New
- Bookmark
- Subscribe
- Mute
- RSS Feed
- Permalink
- Report Inappropriate Content
You may have to use annotations.
data GRAPH;
  ROOM=1; CASE=1; TIME='01jan2018:08:00'dt; output; TIME='01jan2018:09:30'dt; output;
  ROOM=1; CASE=2; TIME='01jan2018:09:50'dt; output; TIME='01jan2018:10:20'dt; output;
  ROOM=1; CASE=3; TIME='01jan2018:10:50'dt; output; TIME='01jan2018:14:50'dt; output;
  ROOM=2; CASE=1; TIME='01jan2018:08:45'dt; output; TIME='01jan2018:11:20'dt; output;
  ROOM=2; CASE=2; TIME='01jan2018:11:55'dt; output; TIME='01jan2018:16:20'dt; output;
  format TIME  datetime.;
run;

data ANNO;
  retain X1SPACE Y1SPACE 'datavalue' FUNCTION 'rectangle' FILLCOLOR 'lightblue' HEIGHTUNIT 'data' ANCHOR 'bottom' WIDTH 5 DISPLAY 'all';
  set GRAPH;
  by ROOM CASE;
  X1=ROOM; Y1=lag(TIME); HEIGHT=dif(TIME);
  if last.CASE;
run;

proc format ;
  value room 1='A' 2='B';
run;

proc sgplot data=GRAPH sganno=ANNO;
 scatter X=ROOM Y=TIME / markerattrs=(color=white);
 xaxis offsetmin=.25 offsetmax=.25 type=discrete ;
 refline TIME / lineattrs=(color=verylightgray);
 format ROOM room.;
run;
- Mark as New
- Bookmark
- Subscribe
- Mute
- RSS Feed
- Permalink
- Report Inappropriate Content
Moved post to Graph forum
- Mark as New
- Bookmark
- Subscribe
- Mute
- RSS Feed
- Permalink
- Report Inappropriate Content
Thank you for your reply.
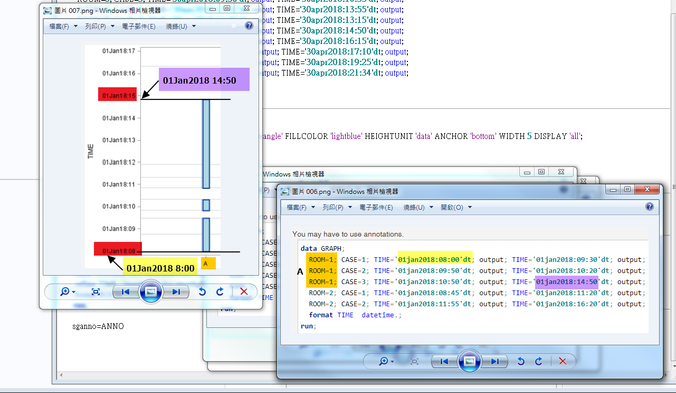
The date range for room A is from 01Jan2018 08:00 to 01Jan2018 14:50.
However, I find that it is incorrect label on the y axis.see red region.
Please help me. Thank you in advance.
- Mark as New
- Bookmark
- Subscribe
- Mute
- RSS Feed
- Permalink
- Report Inappropriate Content
It is not incorrect, it is rounded to the closest hour.
I cant test in the next while, but there may be a restriction on the label length.
I'll look further tomorrow if you haven't found a way.
- Mark as New
- Bookmark
- Subscribe
- Mute
- RSS Feed
- Permalink
- Report Inappropriate Content
We can use the format (e.g., 1Jan 8:00 and 1Jan 14:50, even 8:00 and 14:50). Thank you very much.
- Mark as New
- Bookmark
- Subscribe
- Mute
- RSS Feed
- Permalink
- Report Inappropriate Content
You can do this by creating you own format.
Sadly there is no dttime format.
See how to do this here (from page 14) and the reference is here.
- Mark as New
- Bookmark
- Subscribe
- Mute
- RSS Feed
- Permalink
- Report Inappropriate Content
I got it.
proc sgplot data=GRAPH sganno=ANNO ;
scatter X=ROOM Y=TIME / markerattrs=(color=white) ;
xaxis offsetmin=.25 offsetmax=.25 type=discrete ;
yaxis interval=minute;       /* increase the syntax  */
format ROOM room. ;
run;
ref:
- Mark as New
- Bookmark
- Subscribe
- Mute
- RSS Feed
- Permalink
- Report Inappropriate Content
- Mark as New
- Bookmark
- Subscribe
- Mute
- RSS Feed
- Permalink
- Report Inappropriate Content
April 27 – 30 | Gaylord Texan | Grapevine, Texas
Registration is open
Walk in ready to learn. Walk out ready to deliver. This is the data and AI conference you can't afford to miss.
Register now and save with the early bird rate—just $795!
Learn how use the CAT functions in SAS to join values from multiple variables into a single value.
Find more tutorials on the SAS Users YouTube channel.
SAS Training: Just a Click Away
Ready to level-up your skills? Choose your own adventure.


