Turn on suggestions
Auto-suggest helps you quickly narrow down your search results by suggesting possible matches as you type.
Showing results for
- Home
- /
- Programming
- /
- Graphics
- /
- How to make graph area wider in proc sgplot
Options
- RSS Feed
- Mark Topic as New
- Mark Topic as Read
- Float this Topic for Current User
- Bookmark
- Subscribe
- Mute
- Printer Friendly Page
🔒 This topic is solved and locked.
Need further help from the community? Please
sign in and ask a new question.


Lapis Lazuli | Level 10
- Mark as New
- Bookmark
- Subscribe
- Mute
- RSS Feed
- Permalink
- Report Inappropriate Content
Posted 11-03-2017 12:12 PM
(15917 views)
Hi all,
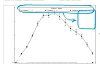
Could you please advise how to make Graph area wider in Proc sgplot. Or should it be defined somewhere else?
1 ACCEPTED SOLUTION
Accepted Solutions


Ammonite | Level 13
- Mark as New
- Bookmark
- Subscribe
- Mute
- RSS Feed
- Permalink
- Report Inappropriate Content
ods graphics on / width=8in height=5in;
Specify both height and width. If you specify one, the other scales proportionately.
3 REPLIES 3
Ammonite | Level 13
- Mark as New
- Bookmark
- Subscribe
- Mute
- RSS Feed
- Permalink
- Report Inappropriate Content
ods graphics on / width=8in height=5in;
Specify both height and width. If you specify one, the other scales proportionately.
Lapis Lazuli | Level 10
- Mark as New
- Bookmark
- Subscribe
- Mute
- RSS Feed
- Permalink
- Report Inappropriate Content
Thank you!
Lapis Lazuli | Level 10
- Mark as New
- Bookmark
- Subscribe
- Mute
- RSS Feed
- Permalink
- Report Inappropriate Content
Final code (if someone is interested):
proc sgplot data=F1 noautolegend;

   styleattrs datacontrastcolors=(black)
               datasymbols=(trianglefilled circlefilled squarefilled diamondfilled triangle circle square diamond)
               datalinepatterns=(solid);

   scatter x=PCTPT y=mean / group=TRT01A
							grouporder=data
                            yerrorlower=lower
                            yerrorupper=upper
                            name = "Scatter" ;
   series x=PCTPT y=mean /  markers group=TRT01A name = "Series";

   xaxis type = discrete;
   yaxis type = log;

   keylegend "Series"  / location=outside position=topright across=1 noborder;
   format PCTPT $PCTPTF.;

run; 
Call for content now open!
It's your turn to help shape SAS Innovate 2027. Share your expertise and inspire the SAS community.
How to Concatenate Values
Learn how use the CAT functions in SAS to join values from multiple variables into a single value.

Find more tutorials on the SAS Users YouTube channel.
SAS Training: Just a Click Away
Ready to level-up your skills? Choose your own adventure.
Discussion stats
-
3 replies
-
11-03-2017 12:12 PM
-
15918 views
-
3 likes
-
2 in conversation
-


