- Home
- /
- Programming
- /
- Graphics
- /
- How to join the points?
- RSS Feed
- Mark Topic as New
- Mark Topic as Read
- Float this Topic for Current User
- Bookmark
- Subscribe
- Mute
- Printer Friendly Page
- Mark as New
- Bookmark
- Subscribe
- Mute
- RSS Feed
- Permalink
- Report Inappropriate Content
Dear everyone,
How are you?
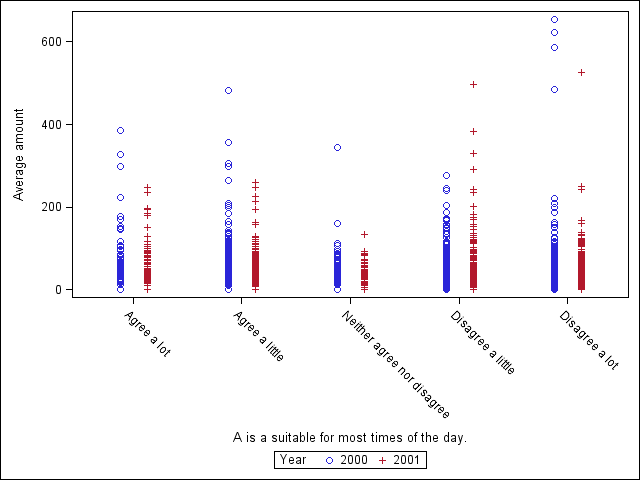
Can I please ask how do I join the 2 points (amount in 2000 & 2001) of the same individual in each level of the x-axis?
Thank you for your help.
FYI here is the code.
ods graphics / antialias=off;
proc sgplot data=tmp;
scatter x=item01 y=amt / group=year groupdisplay=cluster clusterwidth=0.5;
xaxis type=discrete;
run;
ods graphics off;

- Mark as New
- Bookmark
- Subscribe
- Mute
- RSS Feed
- Permalink
- Report Inappropriate Content
The answer always depends on the SAS release you are using. Please include program and sample data so we can run the use case. In the graph above, YEAR is a group role, so values for 2000 and 2001 are plotted as side by side clusters. They do not have specific axis values.
Your best bet is to plot a graph using SGPANEL, with PANELBY=item01. Then, each panel can have a SERIES x=year y=amount. You can use other options to move the header values down to look like axis values, and suppress cell borders, etc.
Potentially, if you have SAS9.40M1, you could define data for a POLYGON plot using discreteoffset=column to draw lines between each group value, but that may be more laborious, but better than SGAnnotate.
Learn how use the CAT functions in SAS to join values from multiple variables into a single value.
Find more tutorials on the SAS Users YouTube channel.
SAS Training: Just a Click Away
Ready to level-up your skills? Choose your own adventure.


