- Home
- /
- Programming
- /
- Graphics
- /
- How do I create an XAXISTABLE with a transparent background inside of ...
- RSS Feed
- Mark Topic as New
- Mark Topic as Read
- Float this Topic for Current User
- Bookmark
- Subscribe
- Mute
- Printer Friendly Page
- Mark as New
- Bookmark
- Subscribe
- Mute
- RSS Feed
- Permalink
- Report Inappropriate Content
Hello All,
I am looking to create a needle SGPLOT in SAS 9.4M3 with both of the following:
- An XAXISTABLE inside of the graphic's XAXIS area (location=inside)
- A transparent background for the entire graphic (as normally accomplished with the noopaque SGPLOT option)
My question is not whether or not this is possible (I understand there can be an SGANNO work-around). My question is whether or not there is a simple solution that will produce an XAXISTABLE inside the XAXIS area with a transparent/noopaque background.
When I submit the following code, I expect that my XAXISTABLE will follow the noopaque option, but it does not.
ods html;
data dateCounts;
 do date="01JAN2017"d to "31DEC2017"d by 1;
    count=floor(101*rand("uniform"));
    output;
  end;
run;

ods graphics/ border=off width=9in height=5.0625in;

proc sgplot data=dateCounts nowall noborder noopaque pad=0;
  needle x=date y=count/ lineattrs=(color=grey thickness=2);
    xaxis display=(nolabel noline noticks) valueattrs=(family=garamond color=gray size=8) interval=month ;
    yaxis display=(nolabel noline noticks) values=(0 50 100) valueattrs=(family=garamond color=gray size=8);
    refline 25 50 75 100/axis=y lineattrs=(color=white thickness=1 ) transparency=0.57;
  xaxistable count / nolabel location=inside position=bottom pad=0 valueattrs=(family=garamond color=gray size=16);
format date monyy5. count comma9.;
run;
Note: If I use the 'location=outside' option in the XAXISTABLE statement, the resulting background will be completely transparent, but I'd rather keep the XAXISTABLE with a 'location=inside' if it is possible to do so with a transparent background.
Thank you,
Chad
Accepted Solutions
- Mark as New
- Bookmark
- Subscribe
- Mute
- RSS Feed
- Permalink
- Report Inappropriate Content
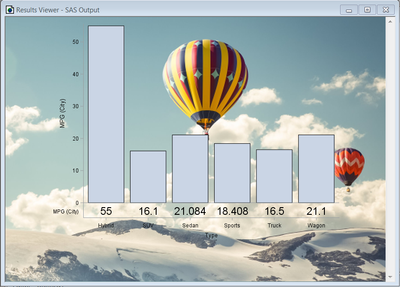
Using your HTML setting and a style with a background image, I place the axis table inside the graph. There is a trick to make the background of the axis table transparent as shown below in the code.
proc template;
define style styles.background;
parent=styles.htmlBlue;
style body from body /
watermark=on
backgroundimage='c:\Work\4K_Images\HOT_Balloon_Only_900.png';
end;
run;
ods html style=styles.background;
ods graphics/ reset border=off;
proc sgplot data=sashelp.cars nowall noborder noopaque pad=0;
vbar type / response=mpg_city stat=mean;
xaxistable mpg_city / stat=mean valueattrs=(size=16) location=inside positioin=bottom;
xaxis colorbands=odd colorbandattrs=(transparency=1);
run;
ods html close;
This places the xaxistable inside the data area, using an "InnerMargin" on the bottom of the container. This inner margin has an opaque background by default. Requesting COLORBANDS on the x-axis makes the inner margin transparent. Since I don't really want the color bands, I set them to fully transparent. Yes, we are planning on a a "real" option to do this in next release.
- Mark as New
- Bookmark
- Subscribe
- Mute
- RSS Feed
- Permalink
- Report Inappropriate Content
cynthia
- Mark as New
- Bookmark
- Subscribe
- Mute
- RSS Feed
- Permalink
- Report Inappropriate Content
Using your HTML setting and a style with a background image, I place the axis table inside the graph. There is a trick to make the background of the axis table transparent as shown below in the code.
proc template;
define style styles.background;
parent=styles.htmlBlue;
style body from body /
watermark=on
backgroundimage='c:\Work\4K_Images\HOT_Balloon_Only_900.png';
end;
run;
ods html style=styles.background;
ods graphics/ reset border=off;
proc sgplot data=sashelp.cars nowall noborder noopaque pad=0;
vbar type / response=mpg_city stat=mean;
xaxistable mpg_city / stat=mean valueattrs=(size=16) location=inside positioin=bottom;
xaxis colorbands=odd colorbandattrs=(transparency=1);
run;
ods html close;
This places the xaxistable inside the data area, using an "InnerMargin" on the bottom of the container. This inner margin has an opaque background by default. Requesting COLORBANDS on the x-axis makes the inner margin transparent. Since I don't really want the color bands, I set them to fully transparent. Yes, we are planning on a a "real" option to do this in next release.
- Mark as New
- Bookmark
- Subscribe
- Mute
- RSS Feed
- Permalink
- Report Inappropriate Content
Never knew about the backgroundimage attribute in proc template. Very cool @Jay54 🙂 Has this been a part of proc template for long?
- Mark as New
- Bookmark
- Subscribe
- Mute
- RSS Feed
- Permalink
- Report Inappropriate Content
Backgroundimage has been part of PROC TEMPLATE for ODS HTML for a long time (since SAS 8). Backgroundimage and WATERMARK have not always been supported in other destinations, but for ODS HTML, it has been available.
cynthia
- Mark as New
- Bookmark
- Subscribe
- Mute
- RSS Feed
- Permalink
- Report Inappropriate Content
Personally, I avoid placing images in the background as they distract from the data in the graph. This was done to illustrate a coding technique. Even simple gradients can be detrimental as group colors can look different over different background colors. This likely falls in Tufte's "Chart Junk" category.
- Mark as New
- Bookmark
- Subscribe
- Mute
- RSS Feed
- Permalink
- Report Inappropriate Content
Thank you @Jay54! - Just the type of solution I was looking for.
@Cynthia_sas next time I will make sure to file my post within the most appropriate board.
Chad
Learn how use the CAT functions in SAS to join values from multiple variables into a single value.
Find more tutorials on the SAS Users YouTube channel.
SAS Training: Just a Click Away
Ready to level-up your skills? Choose your own adventure.


