- Home
- /
- Programming
- /
- Graphics
- /
- Re: Help with SAS SGPLOT bar graphs with 95% CIs
- RSS Feed
- Mark Topic as New
- Mark Topic as Read
- Float this Topic for Current User
- Bookmark
- Subscribe
- Mute
- Printer Friendly Page
- Mark as New
- Bookmark
- Subscribe
- Mute
- RSS Feed
- Permalink
- Report Inappropriate Content
Hi all,
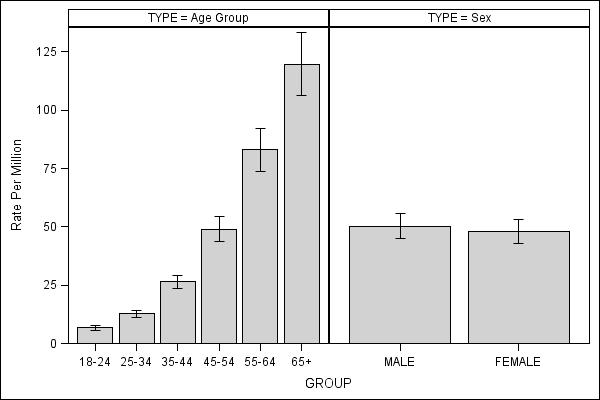
I am trying to generate bar graphs with 95% CIs for a variable called GROUP. The ADJ_PANC is the estimate and ADJ_PANC_LOW and ADJ_PANC_HIGH are 95% CIs. I would like to get these bar graphs separated by a width for a variable called TYPE.
Similarly for the second bar graph, I need the graphs separated by a variable called TYPE. However for this, for x-axis I would like to have the group variable labeled in two lines as they are too long.
eg. for BENIGN TUMOR, I need
BENIGN
TUMOR
For MALIGNANT TUMOR, I need
MALIGNANT
TUMOR
Is there a way I can generate this?
I would really appreciate any help with my sas code.
I am attaching a scanned document for what I am looking for exactly. Also I am attaching my raw csv files and sas code, and the graphs which I got with the sas code.
Please do let me know if you have any questions.
Thank you for your time,
Satish


Accepted Solutions
- Mark as New
- Bookmark
- Subscribe
- Mute
- RSS Feed
- Permalink
- Report Inappropriate Content
For #1, I assume you don't want the label at all, so you can turn it off on the COLAXIS statement:
COLAXIS display=(nolabel);
For #2, use the NOVARNAME option on the PANELBY statement.
For #3, you can control the axes using the ROWAXIS (y-axis) and the COLAXIS (x-axis) statements.
The code below is the same as before, with #1 and #2 added:
proc sgpanel data=YourDataSet;
panelby type / layout=columnlattice uniscale=row novarname; /* to keep the bars the same width, add the PROPORTION option */
colaxis display=(nolabel);
vbarparm category=group response=adj_panc / limitlower=adj_panc_low limitupper=adj_panc_high;
run;
- Mark as New
- Bookmark
- Subscribe
- Mute
- RSS Feed
- Permalink
- Report Inappropriate Content
Try this for your two chart and see if you like it:
proc sgpanel data=YourDataSet;
panelby type / layout=columnlattice uniscale=row; /* to keep the bars the same width, add the PROPORTION option */
vbarparm category=group response=adj_panc / limitlower=adj_panc_low limitupper=adj_panc_high;
run;
If you want to remove the line between the types, use the NOBORDER option on the PANELBY statement.
Hope this helps!
Dan
- Mark as New
- Bookmark
- Subscribe
- Mute
- RSS Feed
- Permalink
- Report Inappropriate Content

Hi Dan,
Your code was helpful. I just need couple of modifications. Would be able to help me with that? I am attaching the figure I got after I used your code.
1. I do not want GROUP on x-axis. Can I remove GROUP from the graph?
2. I do not want Type=Age Group Type=Sex; I just Need Age Group Sex. It would be great if I can get Age Group and Sex on X-axis in place of GROUP.
3. I can control X-axis on sgpanel?
Is there a way I can do that?
I would appreciate if you can help me with this.
Thank you,
Satish
- Mark as New
- Bookmark
- Subscribe
- Mute
- RSS Feed
- Permalink
- Report Inappropriate Content
In my question no. 3. I meant Y-axis limit
- Mark as New
- Bookmark
- Subscribe
- Mute
- RSS Feed
- Permalink
- Report Inappropriate Content
For #1, I assume you don't want the label at all, so you can turn it off on the COLAXIS statement:
COLAXIS display=(nolabel);
For #2, use the NOVARNAME option on the PANELBY statement.
For #3, you can control the axes using the ROWAXIS (y-axis) and the COLAXIS (x-axis) statements.
The code below is the same as before, with #1 and #2 added:
proc sgpanel data=YourDataSet;
panelby type / layout=columnlattice uniscale=row novarname; /* to keep the bars the same width, add the PROPORTION option */
colaxis display=(nolabel);
vbarparm category=group response=adj_panc / limitlower=adj_panc_low limitupper=adj_panc_high;
run;
- Mark as New
- Bookmark
- Subscribe
- Mute
- RSS Feed
- Permalink
- Report Inappropriate Content
Hi Dan,
Thank you. I used the code and it gives me exactly what I am looking for. Can u guide me how/ where to use PROPORTION to give me bar width the same for all?
- Mark as New
- Bookmark
- Subscribe
- Mute
- RSS Feed
- Permalink
- Report Inappropriate Content
I put it in the comment beside the PANELBY statement so you could add it if your version of SAS supports it. After you add it, your PANELBY statement will look like this:
panelby type / layout=columnlattice uniscale=row novarname proportion;
- Mark as New
- Bookmark
- Subscribe
- Mute
- RSS Feed
- Permalink
- Report Inappropriate Content
I use SAS 9.3 and it does not support Proportion option in PANELBY. I am using other option barwidth under vbar options. It does not give me exact same width for all my bars but it is close to what I am looking for.
Satish
- Mark as New
- Bookmark
- Subscribe
- Mute
- RSS Feed
- Permalink
- Report Inappropriate Content
You can answer all your questions yourself by looking at the online documentation for SGPANEL.
Learn how use the CAT functions in SAS to join values from multiple variables into a single value.
Find more tutorials on the SAS Users YouTube channel.
SAS Training: Just a Click Away
Ready to level-up your skills? Choose your own adventure.


