- Home
- /
- Programming
- /
- Graphics
- /
- Gradar: starcircles
- RSS Feed
- Mark Topic as New
- Mark Topic as Read
- Float this Topic for Current User
- Bookmark
- Subscribe
- Mute
- Printer Friendly Page

- Mark as New
- Bookmark
- Subscribe
- Mute
- RSS Feed
- Permalink
- Report Inappropriate Content
Good day.
I'm using gradar proc and I trying to fill additional circle. I can't do anything with it.
This is my code.
proc gradar data=test;
    chart id /  freq=cnt
    overlayvar=color
    cstars=(green, yellow, red)
    wstars=2
    lstars=1
    starcircles=(1)
    cstarcircles=green
    starfill=(solid solid solid)
    cstarfill=( green, yellow, red)
 run;
This is my problem:
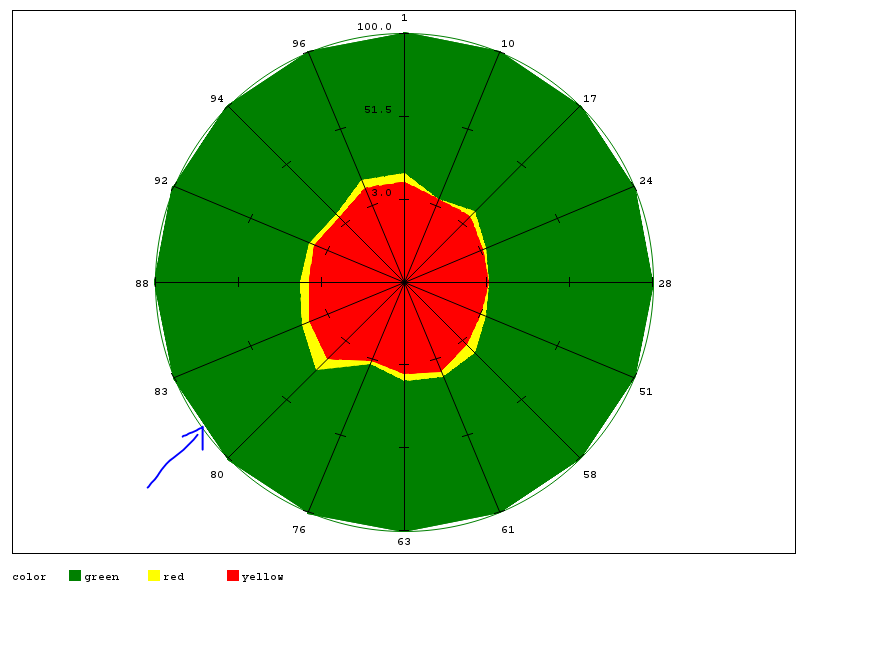
Please, help!
Accepted Solutions

- Mark as New
- Bookmark
- Subscribe
- Mute
- RSS Feed
- Permalink
- Report Inappropriate Content
You show a result but do not describe the "problem". I think you mean that you want the small section of arc filled in.
I think the easiest with this data would be to specify a WSTARCIRCLES=( ) option with a value larger than 1 for the first circle. Possibly WSTARCIRCLES=(3,1,1 )
- Mark as New
- Bookmark
- Subscribe
- Mute
- RSS Feed
- Permalink
- Report Inappropriate Content
Oh, I'm sorry. Yes, I mean I have problem with this section.
Than you, it's work well!
.jpg")
Catch up on SAS Innovate 2026
Nearly 200 sessions are now available on demand in the Innovate Hub.
Watch Now →Learn how use the CAT functions in SAS to join values from multiple variables into a single value.

Find more tutorials on the SAS Users YouTube channel.
SAS Training: Just a Click Away
Ready to level-up your skills? Choose your own adventure.
-
2 replies
-
05-12-2015 05:19 AM
-
2608 views
-
0 likes
-
2 in conversation
-
