- Home
- /
- Programming
- /
- Graphics
- /
- Gchart svg output
- RSS Feed
- Mark Topic as New
- Mark Topic as Read
- Float this Topic for Current User
- Bookmark
- Subscribe
- Mute
- Printer Friendly Page

- Mark as New
- Bookmark
- Subscribe
- Mute
- RSS Feed
- Permalink
- Report Inappropriate Content
Hello,
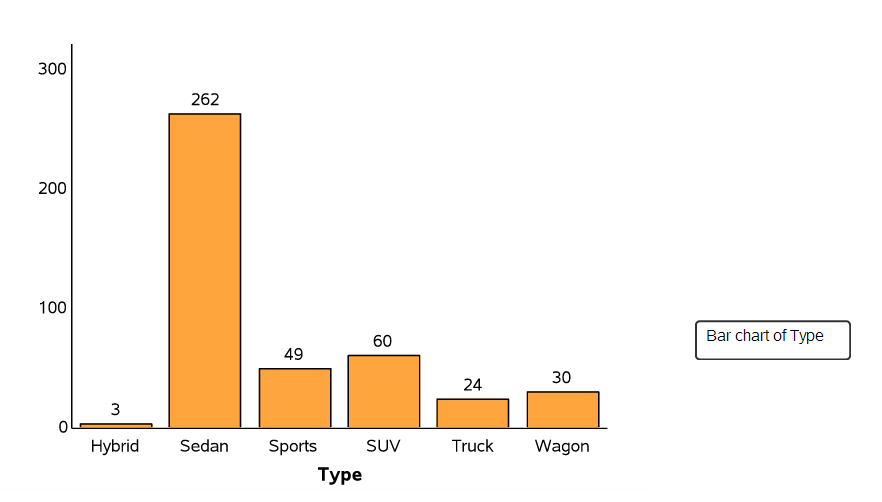
The following code produces a nice svg format graph.
My problem is that hovering over the chart in html displays a box with a "barchart of type" text. Is there a way to get rid of that?
goptions reset=all device=svg hsize=4.8in vsize=3.2in ;
ods listing close;
ods html file="carType.htm" path="c:\" gpath="C:\graphs";
title h=2 "Types of Vehicles Produced Worldwide";
axis1 label=none major=none minor=none;
proc gchart data=sashelp.cars;
vbar type / raxis=axis1 outside=freq noframe ;
run;
quit;
ods html close;
ods listing;
Thanks
abe

- Mark as New
- Bookmark
- Subscribe
- Mute
- RSS Feed
- Permalink
- Report Inappropriate Content
HI.
I noticed that if you change your device to gif, from svg, then you don't get the bar chart of type - box.
But the plot also looks a bit different.
Interesting.
Anca.

- Mark as New
- Bookmark
- Subscribe
- Mute
- RSS Feed
- Permalink
- Report Inappropriate Content
vbar type / raxis=axis1 outside=freq noframe description = '' ;
should fix it.
.jpg")
Catch up on SAS Innovate 2026
Nearly 200 sessions are now available on demand in the Innovate Hub.
Watch Now →Learn how use the CAT functions in SAS to join values from multiple variables into a single value.

Find more tutorials on the SAS Users YouTube channel.
SAS Training: Just a Click Away
Ready to level-up your skills? Choose your own adventure.
-
2 replies
-
08-30-2013 04:57 AM
-
2502 views
-
0 likes
-
3 in conversation
-
