- Home
- /
- Programming
- /
- Graphics
- /
- Gchart Outside Statistic Size
- RSS Feed
- Mark Topic as New
- Mark Topic as Read
- Float this Topic for Current User
- Bookmark
- Subscribe
- Mute
- Printer Friendly Page
- Mark as New
- Bookmark
- Subscribe
- Mute
- RSS Feed
- Permalink
- Report Inappropriate Content
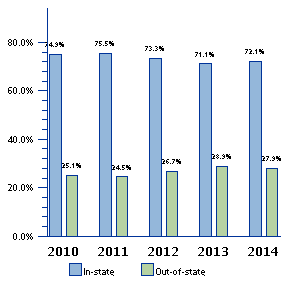
Is there a way to change the outside statistic size of a gchart displayed in Information Delivery Portal via a portlet in SAS 9.2. When I view the graph in Enterprise Guide the size of the outside statistic is reasonable but not in Information Delivery Portal.
axis2 label=none;
axis3 label=none;
title First-time Freshman Admissions by Residency;
proc gchart data=enrollment;
vbar residency /
sumvar=percent_admit_count
legend=legend1 outside=sum
maxis=axis1
raxis=axis2
gaxis=axis3
subgroup=residency
group= four_digit_year
noframe
discrete;
format percent_admit_count percent8.1;
run;
quit;
- Mark as New
- Bookmark
- Subscribe
- Mute
- RSS Feed
- Permalink
- Report Inappropriate Content
With Gchart bar charts, I think you would need to use annotate (instead of the outside= option) to be able to control the size of the text.
April 27 – 30 | Gaylord Texan | Grapevine, Texas
Registration is open
Walk in ready to learn. Walk out ready to deliver. This is the data and AI conference you can't afford to miss.
Register now and save with the early bird rate—just $795!
Learn how use the CAT functions in SAS to join values from multiple variables into a single value.
Find more tutorials on the SAS Users YouTube channel.
SAS Training: Just a Click Away
Ready to level-up your skills? Choose your own adventure.


