- Home
- /
- Programming
- /
- Graphics
- /
- Gchart Axis Maxis Cut Off
- RSS Feed
- Mark Topic as New
- Mark Topic as Read
- Float this Topic for Current User
- Bookmark
- Subscribe
- Mute
- Printer Friendly Page

- Mark as New
- Bookmark
- Subscribe
- Mute
- RSS Feed
- Permalink
- Report Inappropriate Content
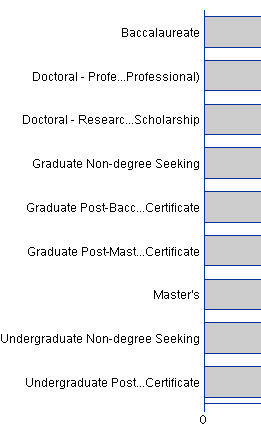
I have a gchart with slightly long category strings. SAS 9.2 chops my category text off, see picture below (I cut off part of the graph in the print screen): Is there a way to make the text smaller or give more space for the maxis. I looked into ways of resizing the image however resizing the image gives problems:
I either lose my needed subgroup (when using statgraph)
I lose my inner statistic when resizing using: goptions reset=all device=png hsize=6in vsize=6in; (however this method does resize the image)
title1 ls=1.5 "2014 Residency Comparison";
axis1 label=none;
axis2 label=none width=10;
axis3 label=none;
legend1 label =none;
proc gchart data=RES_PCENT;
hbar stud_or_deg_level / discrete type=sum sumvar=category_pct inside=subpct nostats noframe
subgroup=residency_desc
gaxis=axis1 maxis=axis2 raxis=axis3
legend = legend1
html=htmlvar;
run;
- Mark as New
- Bookmark
- Subscribe
- Mute
- RSS Feed
- Permalink
- Report Inappropriate Content
Width parameter is not needed.
There appears to be a cap for the number of characters displayed. Even if I enlarge the graph (without changing the device) the text is capped at a set number of characters. I am looking into how to change this cap setting.

- Mark as New
- Bookmark
- Subscribe
- Mute
- RSS Feed
- Permalink
- Report Inappropriate Content
Hi David, Did you get any solution on above mentioned truncation issue? I am also facing same problem.

- Mark as New
- Bookmark
- Subscribe
- Mute
- RSS Feed
- Permalink
- Report Inappropriate Content
The bar labels in your screen-capture appear to be "center truncated" (letters from the middle of the string are replaced with '...')? If this is the case, then I suspect you're using device=java or device=activex?
I would recommend using device=png instead (java & activex do not support the full SAS/Graph functionality in many cases).
In SAS 9.2, dev=png gchart was enhanced, and the length limit for bar labels was increased from 32 characters to 256 characters (if I recall correctly).
- Mark as New
- Bookmark
- Subscribe
- Mute
- RSS Feed
- Permalink
- Report Inappropriate Content
Thanks Robert .. It works for me but now when I use device =PNG tooltip values for bars are not displaying on mouse over.
- Mark as New
- Bookmark
- Subscribe
- Mute
- RSS Feed
- Permalink
- Report Inappropriate Content
With png, you'll need to use gchart's "html=" option, and prepare a variable in your dataset to contain html tags for what you want in the hover-text (and alternatively href drilldowns). This is a little bit of extra work, but adds a *lot* of flexibility! Here's an example that might get you started:
http://robslink.com/SAS/democd23/bar_info.htm
.jpg")
Catch up on SAS Innovate 2026
Nearly 200 sessions are now available on demand in the Innovate Hub.
Watch Now →Learn how use the CAT functions in SAS to join values from multiple variables into a single value.

Find more tutorials on the SAS Users YouTube channel.
SAS Training: Just a Click Away
Ready to level-up your skills? Choose your own adventure.
-
5 replies
-
01-20-2015 04:39 PM
-
4454 views
-
0 likes
-
3 in conversation
-
