- Home
- /
- Programming
- /
- Graphics
- /
- Re: Gchart Axis Maxis Cut Off
- RSS Feed
- Mark Topic as New
- Mark Topic as Read
- Float this Topic for Current User
- Bookmark
- Subscribe
- Mute
- Printer Friendly Page
- Mark as New
- Bookmark
- Subscribe
- Mute
- RSS Feed
- Permalink
- Report Inappropriate Content
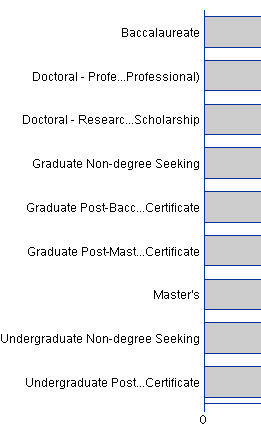
I have a gchart with slightly long category strings. SAS 9.2 chops my category text off, see picture below (I cut off part of the graph in the print screen): Is there a way to make the text smaller or give more space for the maxis. I looked into ways of resizing the image however resizing the image gives problems:
I either lose my needed subgroup (when using statgraph)
I lose my inner statistic when resizing using: goptions reset=all device=png hsize=6in vsize=6in; (however this method does resize the image)

title1 ls=1.5 "2014 Residency Comparison";
axis1 label=none;
axis2 label=none width=10;
axis3 label=none;
legend1 label =none;
proc gchart data=RES_PCENT;
hbar stud_or_deg_level / discrete type=sum sumvar=category_pct inside=subpct nostats noframe
subgroup=residency_desc
gaxis=axis1 maxis=axis2 raxis=axis3
legend = legend1
html=htmlvar;
run;
- Mark as New
- Bookmark
- Subscribe
- Mute
- RSS Feed
- Permalink
- Report Inappropriate Content
Width parameter is not needed.
There appears to be a cap for the number of characters displayed. Even if I enlarge the graph (without changing the device) the text is capped at a set number of characters. I am looking into how to change this cap setting.
- Mark as New
- Bookmark
- Subscribe
- Mute
- RSS Feed
- Permalink
- Report Inappropriate Content
Hi David, Did you get any solution on above mentioned truncation issue? I am also facing same problem.
- Mark as New
- Bookmark
- Subscribe
- Mute
- RSS Feed
- Permalink
- Report Inappropriate Content
The bar labels in your screen-capture appear to be "center truncated" (letters from the middle of the string are replaced with '...')? If this is the case, then I suspect you're using device=java or device=activex?
I would recommend using device=png instead (java & activex do not support the full SAS/Graph functionality in many cases).
In SAS 9.2, dev=png gchart was enhanced, and the length limit for bar labels was increased from 32 characters to 256 characters (if I recall correctly).
- Mark as New
- Bookmark
- Subscribe
- Mute
- RSS Feed
- Permalink
- Report Inappropriate Content
Thanks Robert .. It works for me but now when I use device =PNG tooltip values for bars are not displaying on mouse over.
- Mark as New
- Bookmark
- Subscribe
- Mute
- RSS Feed
- Permalink
- Report Inappropriate Content
With png, you'll need to use gchart's "html=" option, and prepare a variable in your dataset to contain html tags for what you want in the hover-text (and alternatively href drilldowns). This is a little bit of extra work, but adds a *lot* of flexibility! Here's an example that might get you started:
http://robslink.com/SAS/democd23/bar_info.htm
April 27 – 30 | Gaylord Texan | Grapevine, Texas
Registration is open
Walk in ready to learn. Walk out ready to deliver. This is the data and AI conference you can't afford to miss.
Register now and save with the early bird rate—just $795!
Learn how use the CAT functions in SAS to join values from multiple variables into a single value.
Find more tutorials on the SAS Users YouTube channel.
SAS Training: Just a Click Away
Ready to level-up your skills? Choose your own adventure.


