- Home
- /
- Programming
- /
- Graphics
- /
- Gchart - Axis: How to generate Gchart by Descending Order base on a st...
- RSS Feed
- Mark Topic as New
- Mark Topic as Read
- Float this Topic for Current User
- Bookmark
- Subscribe
- Mute
- Printer Friendly Page
- Mark as New
- Bookmark
- Subscribe
- Mute
- RSS Feed
- Permalink
- Report Inappropriate Content
Dear All,
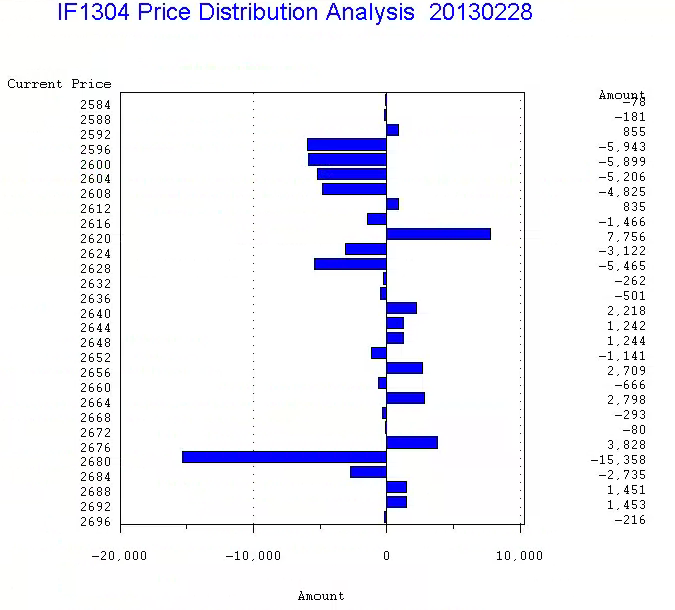
When Gchart produce picture by default ascending order, the output is nice as below:

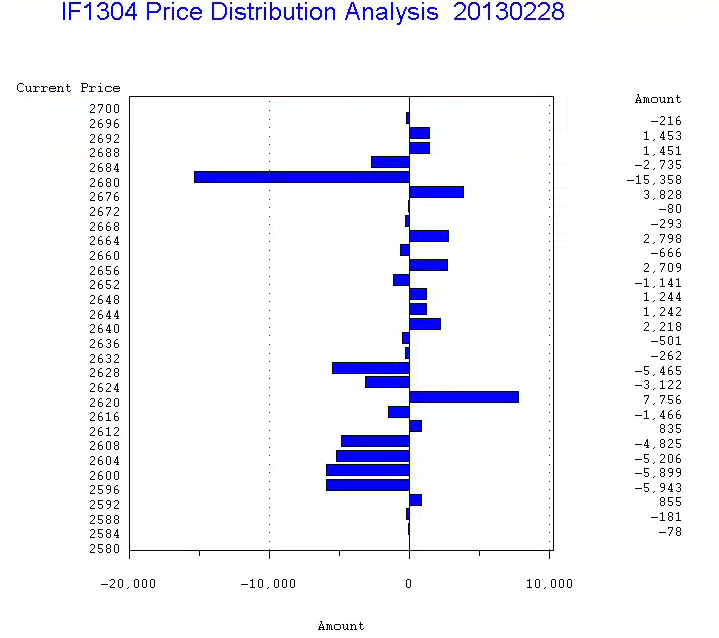
when I changed the order by desending way with ORDER = definition, for example, ORDER=(2700 to 2580 by -4 ) it works well as such:

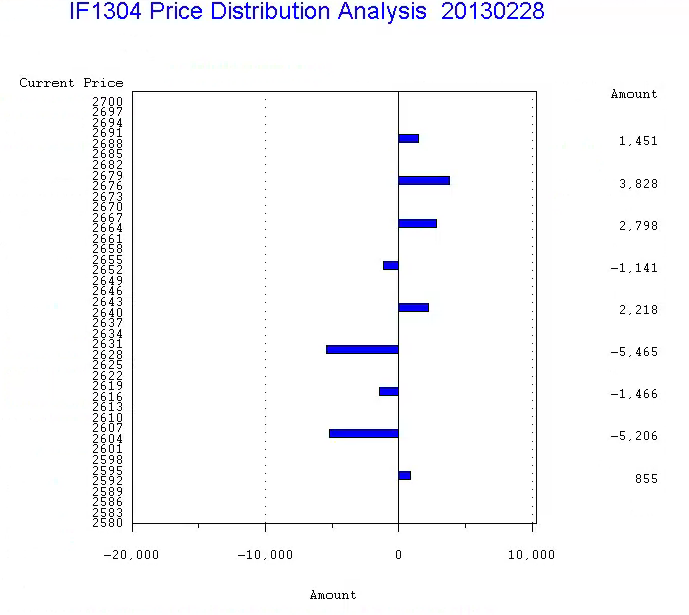
However, if we changed the value of step from 4 to 3, as here ORDER=(2700 to 2580 by -3 ), the output is changed as such:

in another word, the Shape of output looks quite different from the original ascending way, so was the point view of statictical value, i.e. AMOUNT.
So, the question is how to generate Gchart by Descending Order, and the stepping of midpoint should be defined automatically and same like it does by default Ascending way? or how should I specify and define a flexible data set(as here for AXIS) to meet the descending displaying requirement, like it defines and diaplays by Ascending order.
or, does any one have knowledge or document about the internal definition details of default ascending processing?
It would be very much appreciated if anyone can help! Thank you in advance for your time!
Best Regards,
Yuanbin
====THE CODE and Data AS BELOW
data Sample2;
set Interest.Sample2;
run;
proc datasets lib=work nolist;
modify Sample2;
Label Trans_Amount='Amount' Current_Price='Current Price' ;
quit;
ods listing;
filename grafout "C:\Temp\j_BS_2D.gif";
goptions reset=all
device=gif
gsfname=grafout
gsfmode=replace;
GOPTIONS xpixels=400 ypixels=300;
GOPTIONS COLORS = (BLUE/*CX0F3E93 */, BLUE, CYAN, CXD2477C, Green, Red/*CX165627 */);
Legend1
FRAME
POSITION = (BOTTOM CENTER OUTSIDE);
Axis1
STYLE=1
WIDTH=1
/* ORDER=(2580 to 2700 by 4) */
ORDER=(2700 to 2580 by -3 )
LABEL=( "Current Price" )
;
Axis2
STYLE=1
WIDTH=1
MINOR=
(NUMBER=1
)
;
TITLE;
TITLE1 h=2 "IF1304 Price Distribution Analysis" ;
FOOTNOTE;
PROC GCHART DATA=Sample2 gout=work.gseg;
HBAR Current_Price
/ SUMVAR=Trans_Amount
CLIPREF
/* DESCENDING */
FRAME SUM /* NOSTATS */
TYPE=SUM
LEGEND=LEGEND1
COUTLINE=BLACK
MAXIS=AXIS1
RAXIS=AXIS2
LREF=34
CREF=BLUE
AUTOREF
CTEXT=BLACK
CAXIS=BLACK
;
RUN; QUIT;
TITLE; FOOTNOTE;
GOPTIONS RESET=ALL;
Accepted Solutions
- Mark as New
- Bookmark
- Subscribe
- Mute
- RSS Feed
- Permalink
- Report Inappropriate Content
Hey Yuanbin,
I believe what is happening here is that your ORDER option is excluding your data. Even when you use "by 4", you could be loosing data, unless the bins happen to fall in "by 4" increments. When you use "by 3", the exclusion pattern becomes different. In general, it is not good to use the ORDER option for categorical axes. You should use the MIDPOINTS option on the HBAR statement to set the bins, e.g. midpoints=(2700 to 2580 by -3).
Hope this helps!
Dan
- Mark as New
- Bookmark
- Subscribe
- Mute
- RSS Feed
- Permalink
- Report Inappropriate Content
Dear Experts:
If any advice or hlep, it's very much appreciated, Thanks!
Sincerely,
Yuanbin
- Mark as New
- Bookmark
- Subscribe
- Mute
- RSS Feed
- Permalink
- Report Inappropriate Content
When you use a 'by' value in the bar chart's midpoint axis, you are not only controlling the order, but also controlling the grouping (binning) of data each bar is comprised of.
I typically pre-summarize my bar chart data before I run gchart, and I either have a character midpoint variable, or I use the 'discrete' option (so that no grouping (binning) is done on the bars).
Then, if I want to control the orders of the bars in a way that Gchart does not provide, I sort my summarized data set as desired, assign a numeric variable to the data order (such as 'bar_order=_n_'), and then use that variable (bar_order) as my midpoint variable. And I use a user-defined format so that the numeric variable (bar_order) will print in the graph as a text value that I want.
- Mark as New
- Bookmark
- Subscribe
- Mute
- RSS Feed
- Permalink
- Report Inappropriate Content
Hi Robert and Dan,
I just came back and was looking for your advice, Robert's solution is a detailed one, I believed it can shoot the trouble in-deepth , while I applied for the advice from Dan first, it does work also! I thank you all so much for the great help!
Thank you all for your time again!
Sincerely,
Yuanbin
- Mark as New
- Bookmark
- Subscribe
- Mute
- RSS Feed
- Permalink
- Report Inappropriate Content
Hey Yuanbin,
I believe what is happening here is that your ORDER option is excluding your data. Even when you use "by 4", you could be loosing data, unless the bins happen to fall in "by 4" increments. When you use "by 3", the exclusion pattern becomes different. In general, it is not good to use the ORDER option for categorical axes. You should use the MIDPOINTS option on the HBAR statement to set the bins, e.g. midpoints=(2700 to 2580 by -3).
Hope this helps!
Dan
Learn how use the CAT functions in SAS to join values from multiple variables into a single value.
Find more tutorials on the SAS Users YouTube channel.
SAS Training: Just a Click Away
Ready to level-up your skills? Choose your own adventure.


