- Home
- /
- Programming
- /
- Graphics
- /
- GTL offset curvelabel
- RSS Feed
- Mark Topic as New
- Mark Topic as Read
- Float this Topic for Current User
- Bookmark
- Subscribe
- Mute
- Printer Friendly Page
- Mark as New
- Bookmark
- Subscribe
- Mute
- RSS Feed
- Permalink
- Report Inappropriate Content
Hi All,
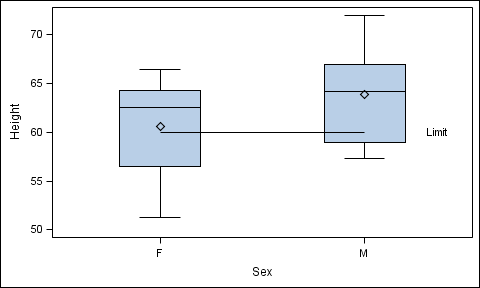
I'm using SAS 9.3 GTL to make a graph that overlays a box plot and a series plot. The series plot uses curvelabel with curvelocation=inside curvelabelposition=end. Problem is that sometimes the label for the series appears on top of the last box. (collision of sorts) I would like it to appear in white space to the right.
Is there some way for me to offset the curvelabel a bit to the right, so that it would not overlay the box (without using curvelocation=outside)? I guess this could be hard, because the seriesplot doesn't know about the boxplot. I can't use curvelocation=outside because in real code this graph is part of a layout lattice cell.
Would settle for hard coding some non-printable white space character, if there is a good way to do that, which would work for html/pdf/rtf destinations. Something like "curvelabel=%str( )Limit".
Sample code below.
Thanks,
--Q.
proc template;
  define statgraph TryBox;
    begingraph;
      layout overlay;
          boxplot x=sex y=Height ;
          seriesplot x=sex y=LimitLine /
             curvelabel="Limit"
             curvelabellocation=inside
             curvelabelposition=end
          ;

      endlayout;
    endgraph;
  end;
run;

data class;
  set sashelp.class;
  LimitLine=60;
run;
proc sort data=class;by sex;run;
proc sgrender data=class template=TryBox;
run;
- Mark as New
- Bookmark
- Subscribe
- Mute
- RSS Feed
- Permalink
- Report Inappropriate Content
With 9.3 I would look up annotating graphs. The annotate facility will let you pick locations and text displayed.
Or Start by generating the graph, without the curvelabel, use the ODS graphics editor to add the text desired.
- Mark as New
- Bookmark
- Subscribe
- Mute
- RSS Feed
- Permalink
- Report Inappropriate Content
One quick fix for this case is to use enough leading non-breaking spaces in your curve label. I create a label with 20 leading nbsp. But that takes your label far from the line itself. Maybe use a legend to identify the line?
data _null_;
lbl='....................Limit';
lbl=translate(lbl, 'A0'x, '.');
call symput ("lbl", lbl);
run;
proc template;
define statgraph TryBox;
begingraph;
layout overlay;
boxplot x=sex y=Height ;
seriesplot x=sex y=LimitLine /
curvelabel="&lbl"
curvelabellocation=inside
curvelabelposition=end
;
endlayout;
endgraph;
end;
run;
data class;
set sashelp.class;
LimitLine=60;
run;
proc sort data=class;by sex;run;
proc sgrender data=class template=TryBox;
run;
- Mark as New
- Bookmark
- Subscribe
- Mute
- RSS Feed
- Permalink
- Report Inappropriate Content
Thanks Sanjay, I'll play with that. In the real setting the boxes are narrower, so I should only need a handful of non-breaking spaces. The labels should be close enough.
April 27 – 30 | Gaylord Texan | Grapevine, Texas
Registration is open
Walk in ready to learn. Walk out ready to deliver. This is the data and AI conference you can't afford to miss.
Register now and save with the early bird rate—just $795!
Learn how use the CAT functions in SAS to join values from multiple variables into a single value.
Find more tutorials on the SAS Users YouTube channel.
SAS Training: Just a Click Away
Ready to level-up your skills? Choose your own adventure.


