- Home
- /
- Programming
- /
- Graphics
- /
- Re: GTL lattice nested in datapanel
- RSS Feed
- Mark Topic as New
- Mark Topic as Read
- Float this Topic for Current User
- Bookmark
- Subscribe
- Mute
- Printer Friendly Page

- Mark as New
- Bookmark
- Subscribe
- Mute
- RSS Feed
- Permalink
- Report Inappropriate Content
I have multiple elements in a lattice layout, but I want them repeated based on a classification variable. Is there any way to do this? I tried just putting them inside a datapanel layout or datalattice layout, but it doesn't work.
For example:
This code produces a bar char with information on either side. These values are all from one year. What if I had 4 years of values and I wanted to produce the same output 4 times, once for each year based all in the same graphic. Is there a way to do this?
data PGA2007;
input Rank 2. Player & $15. Age Events Rounds CutsMade Top10 Wins Earnings;
retain Constant 1;
label CutsMade="Cuts Made" Top10="Top 10s";
format age events wins 3.0;
datalines;
1 Tiger Woods 33 16 61 16 12 7 10867052
2 Phil Mickelson 38 22 73 16 7 3 5819988
3 Vijay Singh 45 27 101 25 7 2 4728377
4 Steve Stricker 41 23 80 19 9 1 4663077
5 K.J. Choi 38 25 88 20 7 2 4587859
6 Rory Sabbatini 32 23 80 18 10 1 4550040
7 Jim Furyk 38 24 84 20 8 1 4154046
8 Zach Johnson 32 23 78 18 5 2 3922338
9 Sergio Garcia 29 19 67 16 7 0 3721185
10 Aaron Baddeley 27 23 82 19 7 1 3441119
;
run;
proc template;
define statgraph BarTableHorz;
begingraph;
entrytitle "Professional Golf Statistics for 2007";
layout lattice / columns=4 columngutter=2
columnweights=(.06 .06 .82 .06);
column2headers;
entry halign=right "Age" / textattrs=(size=7pt weight=bold);
entry halign=right "Events" / textattrs=(size=7pt weight=bold);
entry halign=right "" / textattrs=(size=7pt weight=bold);
entry halign=right "Wins" / textattrs=(size=7pt weight=bold);
endcolumn2headers;
/* columns to left of barchart */
layout overlay / walldisplay=none border=false
yaxisopts=(reverse=true type=discrete display=none)
xaxisopts=(display=none offsetmin=0.3 offsetmax=0);
scatterplot y=player x=constant / markercharacter=age markerattrs=(size=0) ;
endlayout;
layout overlay / walldisplay=none border=false
yaxisopts=(reverse=true type=discrete display=none)
xaxisopts=(display=none offsetmin=.3 offsetmax=0);
scatterplot y=player x=constant / markercharacter=events markerattrs=(size=0);
endlayout;
/* barchart with inset */
layout overlay / yaxisopts=(reverse=true display=(tickvalues) tickvalueattrs=(weight=bold))
xaxisopts=(griddisplay=on labelattrs=(weight=bold)
linearopts=(tickvalueformat=(extractscale=true)) );
barchart x=player y=Earnings / barlabel=true barlabelformat=dollar12. orient=horizontal
outlineattrs=(color=black);
endlayout;
layout overlay / walldisplay=none border=false
yaxisopts=(reverse=true type=discrete display=none)
xaxisopts=(display=none offsetmin=.3 offsetmax=0);
scatterplot y=player x=constant / markercharacter=wins markerattrs=(size=0);
endlayout;
endlayout;
endgraph;
end;
run;
ods listing close;
ods html image_dpi=100 file='BarTableHorz.html' path='.';
ods graphics / reset noborder width=700px height=400px
imagename='BarTableHorz' imagefmt=gif noscale;
proc sgrender data=PGA2007 template=BarTableHorz;
run;
ods html close;
ods listing;
Thanks for any help.
-Jesse
Accepted Solutions

- Mark as New
- Bookmark
- Subscribe
- Mute
- RSS Feed
- Permalink
- Report Inappropriate Content
Each cell in a Layout DataLattice can only be a single cell graph defined in the LAYOUT PROTOTYPE statement. Layout Prototype is essentially a Layout Overlay. You cannot use a multi-cell graph as a prototype in a data lattice. Of course, you can run your Lattice graph above with a BY variable, and get one graph for each year. The main benefit of a Datalattice are the uniform axes across years.
However, if you want to create a prototype that is essentially one graph, and some data columns like the Golf example, that can be done by using the "axis-splitting" technique that I have described in this paper:
http://support.sas.com/resources/papers/proceedings11/281-2011.pdf. See #4 Forest Plot.
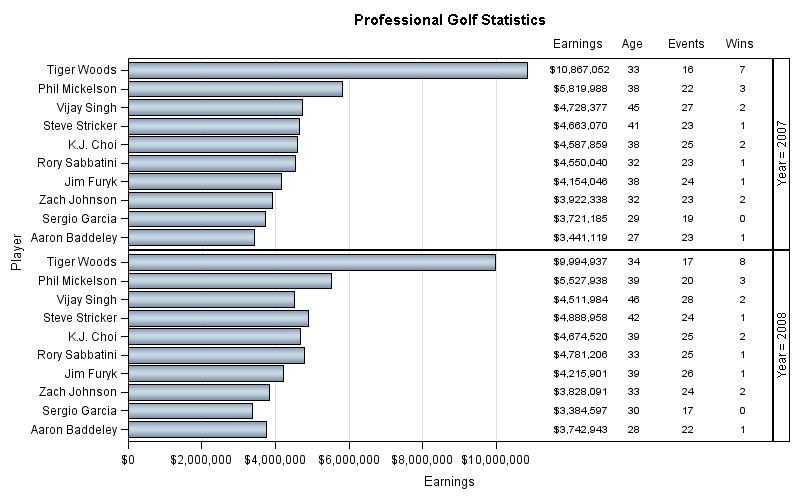
Here is an example. In this example, I have added a variable YEAR to the data, that has two values 2007 and 2008. You can have more values. Then, I have defined a single cell prototype with one bar chart and multiple scatterplots to do the statistics table using the X and X2 axis-splitting technique. Then, I used a layout DataLattice with ROWVAR=Year. With this technique, all the stat columns have to go on one side. If this is what you are looking for, I can clean up and attach the program.
Note, you have to set OFFSETMIN and OFFSETMAX on the COLUMNAXISOPTS and COLUMN2AXISOPTS appropriately based on how many statistics columns you have.
Program:
data PGA;
  input Year Rank  Player $ 9-24  Age Events Rounds CutsMade Top10 Wins Earnings;
  retain Constant 1;
  label CutsMade="Cuts Made" Top10="Top 10s";
  format age events wins 3.0;
  Agelabel='Age';
  EventsLabel='Events';
  WinsLabel='Wins';
  EarningsLabel='Earnings';
  datalines;
2007  1 Tiger Woods      33  16  61 16 12  7 10867052
2007  2 Phil Mickelson   38  22  73 16  7  3  5819988
2007  3 Vijay Singh      45  27 101 25  7  2  4728377
2007  4 Steve Stricker   41  23  80 19  9  1  4663070
2007  5 K.J. Choi        38  25  88 20  7  2  4587859
2007  6 Rory Sabbatini   32  23  80 18 10  1  4550040
2007  7 Jim Furyk        38  24  84 20  8  1  4154046
2007  8 Zach Johnson     32  23  78 18  5  2  3922338
2007  9 Sergio Garcia    29  19  67 16  7  0  3721185
2007 10 Aaron Baddeley   27  23  82 19  7  1  3441119
;
run;

proc sort data=pga out=pga2;
  by descending rank;
  run;


/*--Simulate and add data for Year=2008--*/
data pga3;
  set pga2;
  output;
  Year=2008;
  Rank=mod(rank+2, 10)+1;
  Age=age+1;
  Events=events*(1+0.2*(ranuni(2)-0.5));
  Rounds=rounds*(1+0.2*(ranuni(2)-0.5));
  CutsMade=cutsmade*(1+0.2*(ranuni(2)-0.5));
  Top10=top10*(1+0.2*(ranuni(2)-0.5));
  Wins=wins*(1+0.5*(ranuni(2)-0.5));
  Earnings=earnings*(1+0.2*(ranuni(2)-0.5));
  output;
 run;

/*--Create template for graph--*/
proc template;
  define statgraph BarTableHorz;
  begingraph;
    entrytitle "Professional Golf Statistics";
    layout datalattice rowvar=year / columnaxisopts=(offsetmin=0 offsetmax=0.38 griddisplay=on
                                     linearopts=(tickvalueformat=(extractscale=true)))
                    column2axisopts=(offsetmin=0.7 offsetmax=0.05 display=(tickvalues));
      layout prototype;
        barchart x=player y=Earnings / orient=horizontal skin=modern;
        scatterplot y=player x=earningslabel / markercharacter=earnings xaxis=x2;
        scatterplot y=player x=agelabel / markercharacter=age xaxis=x2;
        scatterplot y=player x=eventslabel / markercharacter=events xaxis=x2;
        scatterplot y=player x=winslabel / markercharacter=wins xaxis=x2;
      endlayout;
    endlayout;
  endgraph;
  end;
run;

/*--Render the graph--*/
ods graphics / reset noborder width=8in height=5in imagename='GolfLattice';
proc sgrender data=PGA3 template=BarTableHorz;
format earnings dollar12.0;
run;
- Mark as New
- Bookmark
- Subscribe
- Mute
- RSS Feed
- Permalink
- Report Inappropriate Content
Each cell in a Layout DataLattice can only be a single cell graph defined in the LAYOUT PROTOTYPE statement. Layout Prototype is essentially a Layout Overlay. You cannot use a multi-cell graph as a prototype in a data lattice. Of course, you can run your Lattice graph above with a BY variable, and get one graph for each year. The main benefit of a Datalattice are the uniform axes across years.
However, if you want to create a prototype that is essentially one graph, and some data columns like the Golf example, that can be done by using the "axis-splitting" technique that I have described in this paper:
http://support.sas.com/resources/papers/proceedings11/281-2011.pdf. See #4 Forest Plot.
Here is an example. In this example, I have added a variable YEAR to the data, that has two values 2007 and 2008. You can have more values. Then, I have defined a single cell prototype with one bar chart and multiple scatterplots to do the statistics table using the X and X2 axis-splitting technique. Then, I used a layout DataLattice with ROWVAR=Year. With this technique, all the stat columns have to go on one side. If this is what you are looking for, I can clean up and attach the program.
Note, you have to set OFFSETMIN and OFFSETMAX on the COLUMNAXISOPTS and COLUMN2AXISOPTS appropriately based on how many statistics columns you have.
Program:
data PGA;
  input Year Rank  Player $ 9-24  Age Events Rounds CutsMade Top10 Wins Earnings;
  retain Constant 1;
  label CutsMade="Cuts Made" Top10="Top 10s";
  format age events wins 3.0;
  Agelabel='Age';
  EventsLabel='Events';
  WinsLabel='Wins';
  EarningsLabel='Earnings';
  datalines;
2007  1 Tiger Woods      33  16  61 16 12  7 10867052
2007  2 Phil Mickelson   38  22  73 16  7  3  5819988
2007  3 Vijay Singh      45  27 101 25  7  2  4728377
2007  4 Steve Stricker   41  23  80 19  9  1  4663070
2007  5 K.J. Choi        38  25  88 20  7  2  4587859
2007  6 Rory Sabbatini   32  23  80 18 10  1  4550040
2007  7 Jim Furyk        38  24  84 20  8  1  4154046
2007  8 Zach Johnson     32  23  78 18  5  2  3922338
2007  9 Sergio Garcia    29  19  67 16  7  0  3721185
2007 10 Aaron Baddeley   27  23  82 19  7  1  3441119
;
run;

proc sort data=pga out=pga2;
  by descending rank;
  run;


/*--Simulate and add data for Year=2008--*/
data pga3;
  set pga2;
  output;
  Year=2008;
  Rank=mod(rank+2, 10)+1;
  Age=age+1;
  Events=events*(1+0.2*(ranuni(2)-0.5));
  Rounds=rounds*(1+0.2*(ranuni(2)-0.5));
  CutsMade=cutsmade*(1+0.2*(ranuni(2)-0.5));
  Top10=top10*(1+0.2*(ranuni(2)-0.5));
  Wins=wins*(1+0.5*(ranuni(2)-0.5));
  Earnings=earnings*(1+0.2*(ranuni(2)-0.5));
  output;
 run;

/*--Create template for graph--*/
proc template;
  define statgraph BarTableHorz;
  begingraph;
    entrytitle "Professional Golf Statistics";
    layout datalattice rowvar=year / columnaxisopts=(offsetmin=0 offsetmax=0.38 griddisplay=on
                                     linearopts=(tickvalueformat=(extractscale=true)))
                    column2axisopts=(offsetmin=0.7 offsetmax=0.05 display=(tickvalues));
      layout prototype;
        barchart x=player y=Earnings / orient=horizontal skin=modern;
        scatterplot y=player x=earningslabel / markercharacter=earnings xaxis=x2;
        scatterplot y=player x=agelabel / markercharacter=age xaxis=x2;
        scatterplot y=player x=eventslabel / markercharacter=events xaxis=x2;
        scatterplot y=player x=winslabel / markercharacter=wins xaxis=x2;
      endlayout;
    endlayout;
  endgraph;
  end;
run;

/*--Render the graph--*/
ods graphics / reset noborder width=8in height=5in imagename='GolfLattice';
proc sgrender data=PGA3 template=BarTableHorz;
format earnings dollar12.0;
run;
- Mark as New
- Bookmark
- Subscribe
- Mute
- RSS Feed
- Permalink
- Report Inappropriate Content
Thanks so much for figuring out a solution for me. This will work perfectly. Hopefully I will be able to apply the information in your paper to my project, but it would be great if you could also send/post the code used in the simple golf example. Thanks again!
-Jesse
- Mark as New
- Bookmark
- Subscribe
- Mute
- RSS Feed
- Permalink
- Report Inappropriate Content
Program added.
.jpg")
Catch up on SAS Innovate 2026
Nearly 200 sessions are now available on demand with the SAS Innovate Digital Pass.
Explore Now →Learn how use the CAT functions in SAS to join values from multiple variables into a single value.

Find more tutorials on the SAS Users YouTube channel.
SAS Training: Just a Click Away
Ready to level-up your skills? Choose your own adventure.
-
3 replies
-
09-29-2011 03:51 PM
-
2660 views
-
0 likes
-
2 in conversation
-
