- Home
- /
- Programming
- /
- Graphics
- /
- GTL barchart question
- RSS Feed
- Mark Topic as New
- Mark Topic as Read
- Float this Topic for Current User
- Bookmark
- Subscribe
- Mute
- Printer Friendly Page

- Mark as New
- Bookmark
- Subscribe
- Mute
- RSS Feed
- Permalink
- Report Inappropriate Content
Hi!
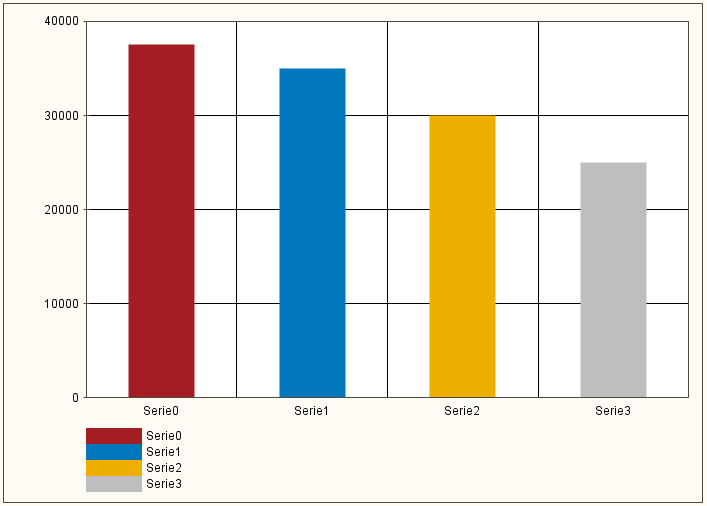
I would like to create a graph as follows using barchart tags instead of needleplot.
Is there anyway to keep the reference lines as they are? I'm using SAS 9.2M3.
Thank you in advance for any help!
Regards,
Paolo


- Mark as New
- Bookmark
- Subscribe
- Mute
- RSS Feed
- Permalink
- Report Inappropriate Content
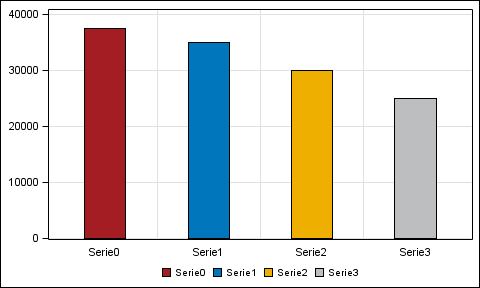
Note some items for this graph:
- This should work with SAS 9.2(TS2M3).
- The reference lines need to have the formatted values. hence the eval(put). This is due to a bug / lack of feature where if you are using user defined formats, the reference line with constant value (not from column) does not have a format.
- You can use the same attributes for the reference lines as the grid lines to make them all look consistent.
- You cannot do this with SGPLOT as you cannot overlay VBAR statements with different category variables. But with SAS 9.3, you can do this using the VBARPARM statements.
proc format;
value dateno
0="Serie0"
1="Serie1"
2="Serie2"
3="Serie3"
4="JAK"
5="ICA"
6="IKANO"
other=" "
;
/* Create sample data */
data BarLine;
format date_0 date_1 date_2 date_3 dateno.;
date_0=0; value_0=37500;
date_05=0.5;
date_1=1; value_1=35000;
date_2=2; value_2=30000;
date_3=3; value_3=25000;
date_4=4; value_4=23000;
date_5=5; value_5=20000;
date_6=6; value_6=17500;
date_7=7; value_7=15500;
run;
title;
footnote;
proc template;
define statgraph Bars;
begingraph;
layout overlay / cycleattrs=true
yaxisopts=(griddisplay=on display=(tickvalues ticks))
xaxisopts=(display=(tickvalues));
barchart x=DATE_0 y=VALUE_0 / fillattrs=(color=CXA41D22) barwidth=0.4 name="item_0" legendlabel="Serie0";
barchart x=DATE_1 y=VALUE_1 / fillattrs=(color=CX0076BD) barwidth=0.4 name="item_1" legendlabel="Serie1";
barchart x=DATE_2 y=VALUE_2 / fillattrs=(color=CXEEAF00) barwidth=0.4 name="item_2" legendlabel="Serie2";
barchart x=DATE_3 y=VALUE_3 / fillattrs=(color=CXBCBEC0) barwidth=0.4 name="item_3" legendlabel="Serie3";
referenceline x=eval(put(0, dateno.)) / lineattrs=graphgridlines discreteoffset=0.5;
referenceline x=eval(put(1, dateno.)) / lineattrs=graphgridlines discreteoffset=0.5;
referenceline x=eval(put(2, dateno.)) / lineattrs=graphgridlines discreteoffset=0.5;
discretelegend 'item_0' 'item_1' 'item_2' 'item_3' / border=false;
endlayout;
endgraph;
end;
run;
ods html close;
ods graphics / reset width=5in height=3in imagename='MultiBar_MidpointRef';
proc sgrender data=barline template=Bars ;
run;
- Mark as New
- Bookmark
- Subscribe
- Mute
- RSS Feed
- Permalink
- Report Inappropriate Content
Thank you!
.jpg")
Catch up on SAS Innovate 2026
Nearly 200 sessions are now available on demand in the Innovate Hub.
Watch Now →Learn how use the CAT functions in SAS to join values from multiple variables into a single value.

Find more tutorials on the SAS Users YouTube channel.
SAS Training: Just a Click Away
Ready to level-up your skills? Choose your own adventure.
-
2 replies
-
10-25-2012 03:29 AM
-
2342 views
-
0 likes
-
2 in conversation
-
