- Home
- /
- Programming
- /
- Graphics
- /
- Re: Forest plot
- RSS Feed
- Mark Topic as New
- Mark Topic as Read
- Float this Topic for Current User
- Bookmark
- Subscribe
- Mute
- Printer Friendly Page


- Mark as New
- Bookmark
- Subscribe
- Mute
- RSS Feed
- Permalink
- Report Inappropriate Content
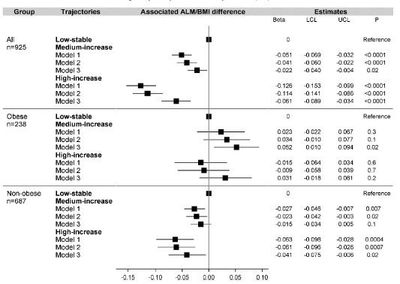
I want to make a forest plot of various categories. And, I will really appreciate if someone can help me by providing the code to produce a graph same as the attached file.
Thanks.


- Mark as New
- Bookmark
- Subscribe
- Mute
- RSS Feed
- Permalink
- Report Inappropriate Content
The Graphically Speaking blog is full of code examples like this.
I link to all posts with the tag "Forst Plot" below.
https://blogs.sas.com/content/graphicallyspeaking/tag/forest-plot/


- Mark as New
- Bookmark
- Subscribe
- Mute
- RSS Feed
- Permalink
- Report Inappropriate Content


- Mark as New
- Bookmark
- Subscribe
- Mute
- RSS Feed
- Permalink
- Report Inappropriate Content
- Mark as New
- Bookmark
- Subscribe
- Mute
- RSS Feed
- Permalink
- Report Inappropriate Content
If you have SAS 9.4 or higher, it is better to go with more recent links. The "Related Topic" article seems a bit old.

Call for content now open!
It's your turn to help shape SAS Innovate 2027. Share your expertise and inspire the SAS community.
Learn how use the CAT functions in SAS to join values from multiple variables into a single value.

Find more tutorials on the SAS Users YouTube channel.
SAS Training: Just a Click Away
Ready to level-up your skills? Choose your own adventure.
-
4 replies
-
12-06-2018 12:30 PM
-
3161 views
-
2 likes
-
4 in conversation
-


