- Home
- /
- Programming
- /
- Graphics
- /
- Font does not look like arial
- RSS Feed
- Mark Topic as New
- Mark Topic as Read
- Float this Topic for Current User
- Bookmark
- Subscribe
- Mute
- Printer Friendly Page

- Mark as New
- Bookmark
- Subscribe
- Mute
- RSS Feed
- Permalink
- Report Inappropriate Content
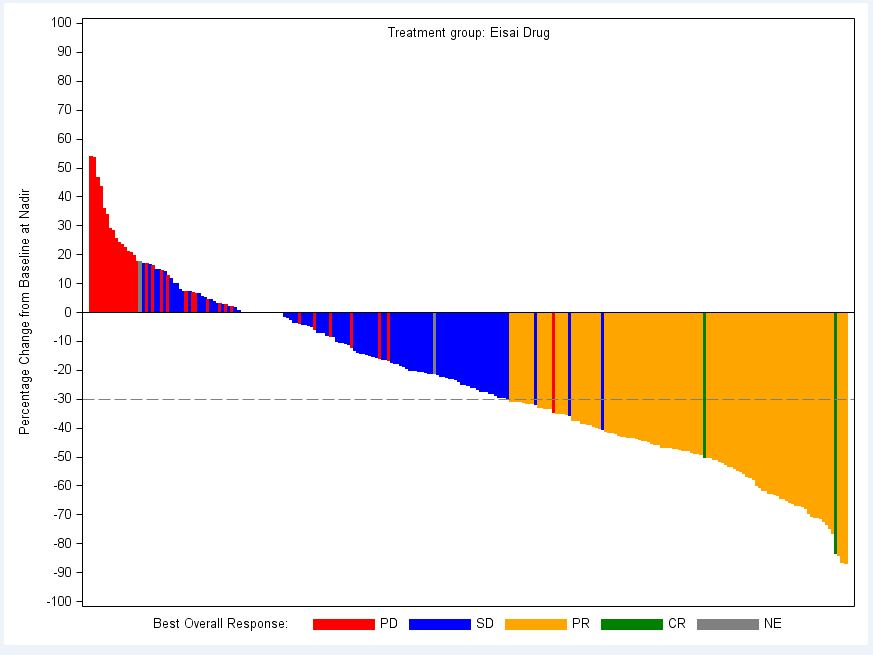
Im producing a plot using GTL and the font on the vertical axis is set as arial. only it doenst appear to be arial. All the rest of the text appears to be correct, just this axis. log doesnt give any error or warning (or clue that its not arial)
code below (which is part of a larger macro) and plot attached.
proc template;
define statgraph Placebo;
dynamic _x _y _var _label _trt;
begingraph / border = false;
discreteattrmap name="colorbysign" / ignorecase=true;
value "PD (n=35) " / fillattrs=GraphData1(color=red ) markerattrs=GraphData1(color=red ) lineattrs=GraphData1(color=red );
value "SD (n=103) " / fillattrs=GraphData1(color=blue ) markerattrs=GraphData1(color=blue ) lineattrs=GraphData1(color=blue ) ;
value "PR (n=104) " / fillattrs=GraphData1(color=orange ) markerattrs=GraphData1(color=orange ) lineattrs=GraphData1(color=orange ) ;
value "CR (n=2) " / fillattrs=GraphData1(color=green ) markerattrs=GraphData1(color=green ) lineattrs=GraphData1(color=green );
value "NE (n=3) " / fillattrs=GraphData1(color=grey ) markerattrs=GraphData1(color=grey ) lineattrs=GraphData1(color=grey ) ;
enddiscreteattrmap;
legenditem type=line name="PD" / LABEL='PD' lineattrs=GraphData1(color=red THICKNESS=10) labelattrs=(size=9 family="Arial") ;
legenditem type=line name="SD" / LABEL='SD' lineattrs=GraphData1(color=blue THICKNESS=10) labelattrs=(size=9 family="Arial");
legenditem type=line name="PR" / LABEL='PR' lineattrs=GraphData1(color=orange THICKNESS=10) labelattrs=(size=9 family="Arial") ;
legenditem type=line name="CR" / LABEL='CR' lineattrs=GraphData1(color=green THICKNESS=10) labelattrs=(size=9 family="Arial");
legenditem type=line name="NE" / LABEL='NE' lineattrs=GraphData1(color=grey THICKNESS=10) labelattrs=(size=9 family="Arial");
discreteattrvar attrvar=signvar var=_var attrmap="colorbysign";
layout overlay / yaxisopts=(linearopts=(viewmin=-100 viewmax=100 tickvaluesequence=(start=-100 end=100 increment=10))
labelattrs=(size=9 family="Arial") label="Percentage Change from Baseline at Nadir" )
xaxisopts=(display=none );
barchart x=_x y=_y / group=signvar name='b' display=all groupdisplay=cluster;
discretelegend "PD" "SD" "PR" "CR" "NE" / title=_label titleattrs=(size=9 family="Arial") BORDER=false;
*referenceline y=20 / lineattrs=(pattern=4);
referenceline y=-30 / lineattrs=(pattern=4);
entry halign=center "Treatment group: " _trt / location=inside valign=top textattrs=(size=9 family="Arial");
endlayout;
endgraph;
end;
proc sgrender data= Placebo template=Placebo;
dynamic _x = 'SUBJID'
_y = 'tarpchg'
_var = 'bor_c'
_trt = 'Comparator'
_label ='Best Overall Response:' ;
run;


- Mark as New
- Bookmark
- Subscribe
- Mute
- RSS Feed
- Permalink
- Report Inappropriate Content
Hi,
I cannot find anything anywhere which states that family="" is valid syntax on a yaxisopts statement. So what I suspect is happening is that GTL is fine with your label text, however it ignores that bit and defaults to whatever style is in effect. TBH I always keep my style template separate from the graph template anyways, so:
proc template;
define style Styles.MyGraph / store = WORK.TEMPLAT;
parent = Styles.tlg;
style GraphFonts /
'GraphDataFont' = ("Arial",9pt)
'GraphValueFont' = ("Arial",9pt)
'GraphLabelFont' = ("Arial",9pt)
'GraphFootnoteFont' = ("Arial",9pt)
'GraphTitleFont' = ("Arial",9pt);
style GraphWalls from GraphWalls /
frameborder = off ;
end;
run;
ods rtf file="..." style=mygraph;
proc sgrender...
ods rtf close;

- Mark as New
- Bookmark
- Subscribe
- Mute
- RSS Feed
- Permalink
- Report Inappropriate Content
Yes, Labelattrs supports FAMILY. Looks under text-options.
LABELATTRS=style-element | style-element (text-options) | (text-options)
If the specified font is not found, it will default to other font as specified in the style and registry. Arial is a Windows font, and may not be available on all platforms. In such cases Albany AMT may be used, which is a SAS supplied sans-serif font.
- Mark as New
- Bookmark
- Subscribe
- Mute
- RSS Feed
- Permalink
- Report Inappropriate Content
Its using arial throughout the rest of the plot so its available. it just doesnt seem to use it on this label.
Hmm, its odd. looks ok in the original png file. let me investigate further.
.jpg")
Catch up on SAS Innovate 2026
Nearly 200 sessions are now available on demand in the Innovate Hub.
Watch Now →Learn how use the CAT functions in SAS to join values from multiple variables into a single value.

Find more tutorials on the SAS Users YouTube channel.
SAS Training: Just a Click Away
Ready to level-up your skills? Choose your own adventure.
-
3 replies
-
07-14-2014 09:00 AM
-
3594 views
-
0 likes
-
3 in conversation
-
