- Home
- /
- Programming
- /
- Graphics
- /
- Data for graph
- RSS Feed
- Mark Topic as New
- Mark Topic as Read
- Float this Topic for Current User
- Bookmark
- Subscribe
- Mute
- Printer Friendly Page

- Mark as New
- Bookmark
- Subscribe
- Mute
- RSS Feed
- Permalink
- Report Inappropriate Content
Good day for all!
I'm working in Guide and I want to create a graph like this (with different numbers, I have problem with numbers for graph not with graph):
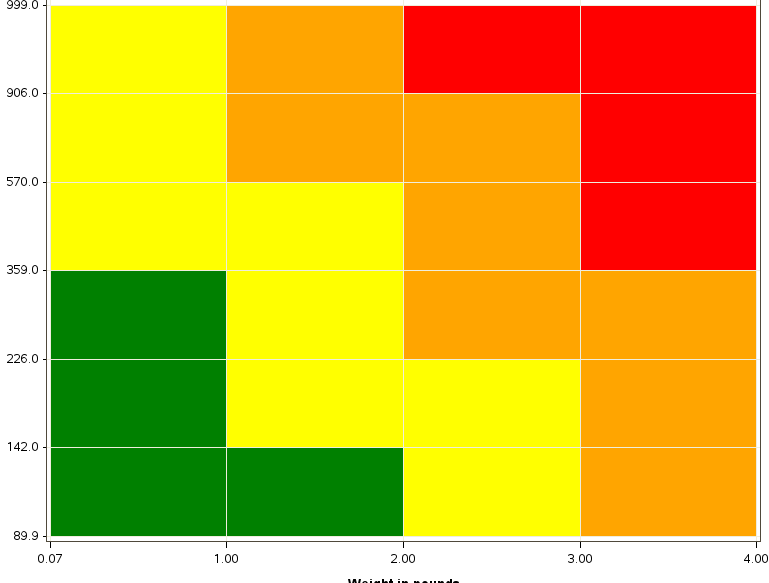
I'm drawing blocks with annotation help. There is my graph.
goptions reset=all cback=white border htitle=12pt htext=10pt;
data anno;
length function color $64;
retain line 0 xsys ysys "2" ;
set TESTLIB.TESTFORROSK4;
function="move"; x=0.07; y=89.895184; output;
function="bar"; x=1; y=142; color="green"; line=1; style="solid"; output;
function="move"; x=1; y=89.895184; output;
function="bar"; x=2; y=142; color="green"; line=1; style="solid"; output;
function="move"; x=2; y=89.895184; output;
function="bar"; x=3; y=142; color="yellow"; line=1; style="solid"; output;
function="move"; x=3; y=89.895184; output;
function="bar"; x=4; y=142; color="orange"; line=1; style="solid"; output;
function="move"; x=0.07; y=142; output;
function="bar"; x=1; y=226; color="green"; line=1; style="solid"; output;
function="move"; x=1; y=142; output;
function="bar"; x=2; y=226; color="yellow"; line=1; style="solid"; output;
function="move"; x=2; y=142; output;
function="bar"; x=3; y=226; color="yellow"; line=1; style="solid"; output;
function="move"; x=3; y=142; output;
function="bar"; x=4; y=226; color="orange"; line=1; style="solid"; output;
function="move"; x=0.07; y=226; output;
function="bar"; x=1; y=359; color="green"; line=1; style="solid"; output;
function="move"; x=1; y=226; output;
function="bar"; x=2; y=359; color="yellow"; line=1; style="solid"; output;
function="move"; x=2; y=226; output;
function="bar"; x=3; y=359; color="orange"; line=1; style="solid"; output;
function="move"; x=3; y=226; output;
function="bar"; x=4; y=359; color="orange"; line=1; style="solid"; output;
function="move"; x=0.07; y=359; output;
function="bar"; x=1; y=570; color="yellow"; line=1; style="solid"; output;
function="move"; x=1; y=359; output;
function="bar"; x=2; y=570; color="yellow"; line=1; style="solid"; output;
function="move"; x=2; y=359; output;
function="bar"; x=3; y=570; color="orange"; line=1; style="solid"; output;
function="move"; x=3; y=359; output;
function="bar"; x=4; y=570; color="red"; line=1; style="solid"; output;
function="move"; x=0.07; y=570; output;
function="bar"; x=1; y=906; color="yellow"; line=1; style="solid"; output;
function="move"; x=1; y=570; output;
function="bar"; x=2; y=906; color="orange"; line=1; style="solid"; output;
function="move"; x=2; y=570; output;
function="bar"; x=3; y=906; color="orange"; line=1; style="solid"; output;
function="move"; x=3; y=570; output;
function="bar"; x=4; y=906; color="red"; line=1; style="solid"; output;
function="move"; x=0.07; y=906; output;
function="bar"; x=1; y=999; color="yellow"; line=1; style="solid"; output;
function="move"; x=1; y=906; output;
function="bar"; x=2; y=999; color="orange"; line=1; style="solid"; output;
function="move"; x=2; y=906; output;
function="bar"; x=3; y=999; color="red"; line=1; style="solid"; output;
function="move"; x=3; y=906; output;
function="bar"; x=4; y=999; color="red"; line=1; style="solid"; output;
run;
proc gplot data=TESTLIB.TESTFORROSK4;
plot D*B / haxis=axis1 vaxis=axis2
annotate=anno
GRID;
symbol1 interpol=none value=none color=white;
axis1 color= black ORDER=0.07 1 2 3 4 ;
axis2 color= black ORDER=89.895184 142 226 359 570 906 999 ;
run;
quit;
Now I need to put these numbers in coordinates automatically. Get them off in the previous table. My data from previous table:
Y | X |
6.9320657556 | . |
13.864131511 | . |
27.728263022 | . |
55.456526045 | . |
110.91305209 | . |
221.82610418 | . |
443.65220836 | . |
. | 0.0211314174 |
. | 0.0845256696 |
. | 0.3381026786 |
. | 0.3381026786 |
. | 1.3524107143 |
I didn't know how I can accumulate numbers in one table. I try to adapt this algorithm to guide but I have some problem with it.
for (i=0; i<6; i++){
for (j=1; j<7; j++){
x = i, y = j;
}
}
For example, I need ability to return to the previouse numbers for "function=move".
There is what I'm wrote (the first steps):
DATA fullDotsTable;
SET WORK.MERGEABDOTS;
%let tempA;
if (_n_=1) then do;
call symput("tempA", A);
end;
else do;
x = B; y = A;
yv = symget("tempA");
call symput("tempA", A);
end;
RUN;
I think I need some SQL in my code but I don't know how I can succes with it. Please, help!
Accepted Solutions

- Mark as New
- Bookmark
- Subscribe
- Mute
- RSS Feed
- Permalink
- Report Inappropriate Content
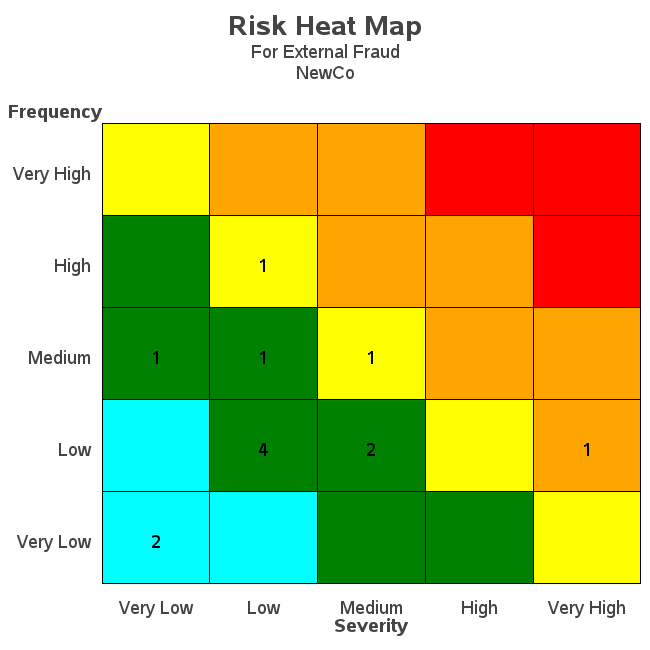
Or, here's another one that might be more similar to what you're wanting...
http://www.robslink.com/SAS/democd22/heatmap.htm
http://www.robslink.com/SAS/democd22/heatmap_info.htm
- Mark as New
- Bookmark
- Subscribe
- Mute
- RSS Feed
- Permalink
- Report Inappropriate Content
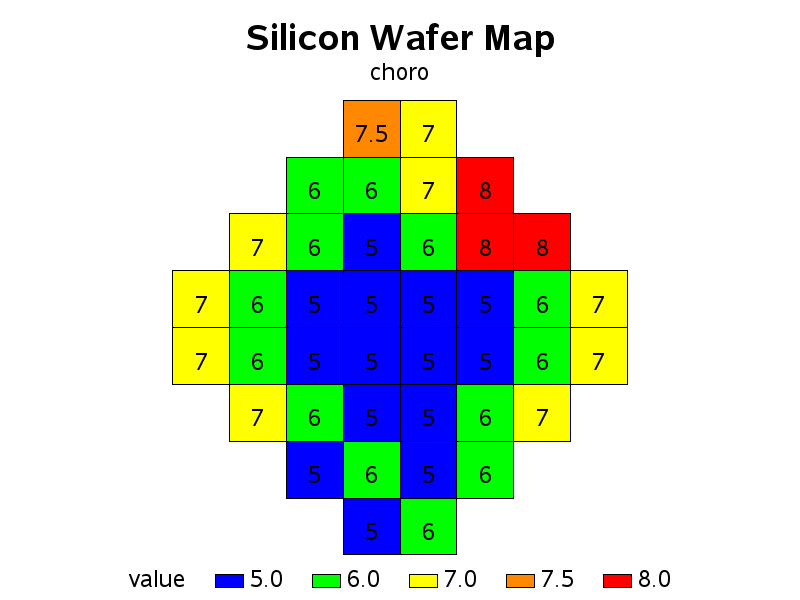
I think the following example might help you. I use Proc SQL to calculate the average x/y center of each square, and then annotate some text there...
http://www.robslink.com/SAS/democd10/first.htm
http://www.robslink.com/SAS/democd10/first.sas
proc sql noprint;
create table lablanno as
select unique id, avg(x) as x, avg(y) as y, value
from my_data
group by id;
quit; run;
data lablanno; set lablanno;
xsys='2'; ysys='2'; hsys='3'; when='A';
position='5'; size=4; style="albany amt";
function='label';
text=trim(left(value));
run;
- Mark as New
- Bookmark
- Subscribe
- Mute
- RSS Feed
- Permalink
- Report Inappropriate Content
Thank you for the example! It's not exactly what I wanted but it will be very helpful for me anyway.
- Mark as New
- Bookmark
- Subscribe
- Mute
- RSS Feed
- Permalink
- Report Inappropriate Content
Or, here's another one that might be more similar to what you're wanting...
http://www.robslink.com/SAS/democd22/heatmap.htm
http://www.robslink.com/SAS/democd22/heatmap_info.htm
- Mark as New
- Bookmark
- Subscribe
- Mute
- RSS Feed
- Permalink
- Report Inappropriate Content
Thank you!
.jpg")
Catch up on SAS Innovate 2026
Nearly 200 sessions are now available on demand with the SAS Innovate Digital Pass.
Explore Now →Learn how use the CAT functions in SAS to join values from multiple variables into a single value.

Find more tutorials on the SAS Users YouTube channel.
SAS Training: Just a Click Away
Ready to level-up your skills? Choose your own adventure.
-
4 replies
-
11-07-2014 06:23 AM
-
3393 views
-
3 likes
-
2 in conversation
-
