- Home
- /
- Programming
- /
- Graphics
- /
- Customizing Proc Loess
- RSS Feed
- Mark Topic as New
- Mark Topic as Read
- Float this Topic for Current User
- Bookmark
- Subscribe
- Mute
- Printer Friendly Page
- Mark as New
- Bookmark
- Subscribe
- Mute
- RSS Feed
- Permalink
- Report Inappropriate Content
I am running proc loess and would like the dots to be different colors based on a variable. The variable values are A, B, or C and I want the dots to be a specific color depending on if they are A, B, or C. I would still like all the data to remain on the same graph. I would also like a legend. I couldn't find the option within proc loess so I was hoping maybe there was a global option or format that could do it.
Thanks
SAS 9.4
proc loess data=Veh_All_Ramp1_106 plots(only)=fit;
	model speed=distance / smooth=0.5;
run;Accepted Solutions
- Mark as New
- Bookmark
- Subscribe
- Mute
- RSS Feed
- Permalink
- Report Inappropriate Content
The easiest way to accomplish this is to use PROC SGPLOT and overlay a loess curve on top of a scatter plot with the GROUP= option.
proc sgplot data=sashelp.cars(obs=100);
scatter x=weight y=mpg_city / group=origin markerattrs=(symbol=CircleFilled);
loess x=weight y=mpg_city / smooth=0.5 nomarkers;
run;- Mark as New
- Bookmark
- Subscribe
- Mute
- RSS Feed
- Permalink
- Report Inappropriate Content
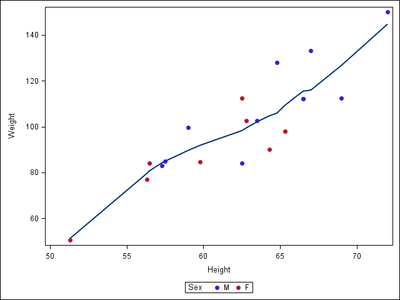
Here is an example using sashelp.class:
proc sgplot data=sashelp.class;
loess x=height y=weight / nomarkers smooth=0.5;
scatter x=height y=weight / group=sex markerattrs=(symbol=circlefilled);
run;Learn how use the CAT functions in SAS to join values from multiple variables into a single value.
Find more tutorials on the SAS Users YouTube channel.
SAS Training: Just a Click Away
Ready to level-up your skills? Choose your own adventure.


