- Home
- /
- Programming
- /
- Graphics
- /
- Creating a map with combined boundaries - distorted image
- RSS Feed
- Mark Topic as New
- Mark Topic as Read
- Float this Topic for Current User
- Bookmark
- Subscribe
- Mute
- Printer Friendly Page
- Mark as New
- Bookmark
- Subscribe
- Mute
- RSS Feed
- Permalink
- Report Inappropriate Content
Hello,
I am trying to create a map of the US showing only state and MSA (metropolitan statistical area) boundaries, using county-level data (maps.uscounty). I am currently using a guide to help me, but am still having difficulty (see link below) http://www2.sas.com/proceedings/sugi29/251-29.pdf
I was able to create an MSA variable (which combines several counties) and merge it with the map file based on county ID. In concert with the GREMOVE procedure, this should remove the barriers between counties within MSAs. However, when I invoke GMAP, it looks distorted.
So then I try GPROJECT, which should correct the distortion, but then it tells me that I have data on both sides of the equator (see error message below).
NOTE: PARALLEL1 = -4.960619304.
NOTE: PARALLEL2 = 8.0288480358.
ERROR: Standard parallels lie on opposite sides of the equator.
ERROR: Equator is too close to the median latitude of the map data set for default parallel calculation. Try specifying PARALLEL1
and PARALLEL2 values explicitly.
However, that can't be the case, because I am only using US data. Oddly, when I look at the SAS projected latitude in the SAS provided map files, there are negative latitude values. I am not sure what to think.
I am able to graph the data just fine (at the county level) before GREMOVE, but after that it all becomes distorted. Any ideas?
See code below:
proc sort data=MSA_MAP;
by msa;
run;
proc gremove
data=MSA_MAP
out=MSA_MAP_1;
by msa;
id county;
run;
proc gproject
data=MSA_MAP_1
out=MSA_MAP_2;
id msa;
run;
pattern v=e;
proc gmap
data=MSA_MAP_2
map=MSA_MAP_2
all;
id msa;
choro Phys_Den_Tot_MD / discrete coutline=black;
format Phys_Den_Tot_MD Phys_Den_Tot_MD_.;
run;
- Mark as New
- Bookmark
- Subscribe
- Mute
- RSS Feed
- Permalink
- Report Inappropriate Content
maps.uscounty X and Y positions are already projected coordinates, you cannot project them again. Try using the mapsgfk.us_counties dataset which has LAT and LONG (unprojected) coordinates instead.
- Mark as New
- Bookmark
- Subscribe
- Mute
- RSS Feed
- Permalink
- Report Inappropriate Content
Okay, so I tried this approach but the gproject function apparently only works for radian coordinates. The mapsgfk.us_counties has clyndrical coordinates, which doesn't project with gproject (as it is an experimental procedure). If there was a county-level map with un-projected radian coordinates, I think I could do it successfully. Alternatively, I did map the mapsgfk.us_counties data and got a correct map without the lines, but it was distorted. If there were someway to project it (as it has clyndrical coordinates) I think it would work.
I also tried proc greduce, per recommendation from another SAS community forum, but that didn't work either.
When I use the projected uscounties data, I get the following image (see attached). You will note in a few areas there are lines between counties/MSAs. They are not even adjacent counties/MSAs, often several states away. I used the proc gremove to remove the county boundaries within MSAs - converting counties to MSAs where possible. These lines seem to appear only after this procedure is done.
I may not have all the terminology down, so hopefully I am explaining this correctly.
Other possible ways to get this to work? Any advice would be greatly appreciated! Thanks!
- Mark as New
- Bookmark
- Subscribe
- Mute
- RSS Feed
- Permalink
- Report Inappropriate Content
Probably the quickest/easiest most direct replacement would be using the unprojected maps.counties, rather than the projected maps.uscounty.
One problem though, when projecting the map on your own, is that Alaska and Hawaii will be in their 'proper' location, rather than moved & re-sized to fit in the bottom/left corner of the map.
I'm thinking this "should" work ok using already-projected maps.uscounty (without re-projecting it). Could you provide some more info about how it looks 'distorted'?
- Mark as New
- Bookmark
- Subscribe
- Mute
- RSS Feed
- Permalink
- Report Inappropriate Content
- Mark as New
- Bookmark
- Subscribe
- Mute
- RSS Feed
- Permalink
- Report Inappropriate Content
- Mark as New
- Bookmark
- Subscribe
- Mute
- RSS Feed
- Permalink
- Report Inappropriate Content
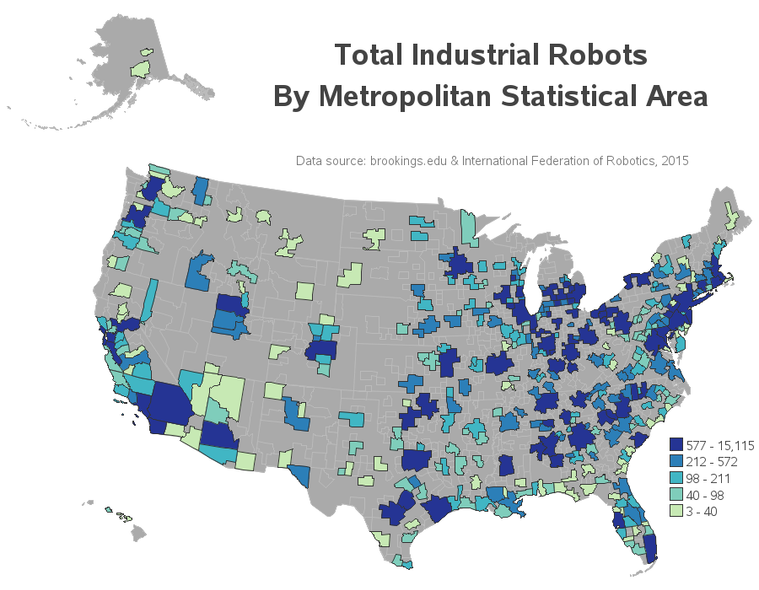
Perhaps rather than trying to create a MSA map from the counties map, you could re-use this example:
http://robslink.com/SAS/democd94/us_msa_robots_info.htm
Which I used in this blog:
https://blogs.sas.com/content/sastraining/2017/08/17/mapping-out-the-next-robot-invasion/
April 27 – 30 | Gaylord Texan | Grapevine, Texas
Registration is open
Walk in ready to learn. Walk out ready to deliver. This is the data and AI conference you can't afford to miss.
Register now and save with the early bird rate—just $795!
Learn how use the CAT functions in SAS to join values from multiple variables into a single value.
Find more tutorials on the SAS Users YouTube channel.
SAS Training: Just a Click Away
Ready to level-up your skills? Choose your own adventure.


