- Home
- /
- Programming
- /
- Graphics
- /
- Re: Creating a Texas Map with 3 colors
- RSS Feed
- Mark Topic as New
- Mark Topic as Read
- Float this Topic for Current User
- Bookmark
- Subscribe
- Mute
- Printer Friendly Page
- Mark as New
- Bookmark
- Subscribe
- Mute
- RSS Feed
- Permalink
- Report Inappropriate Content
Hi,
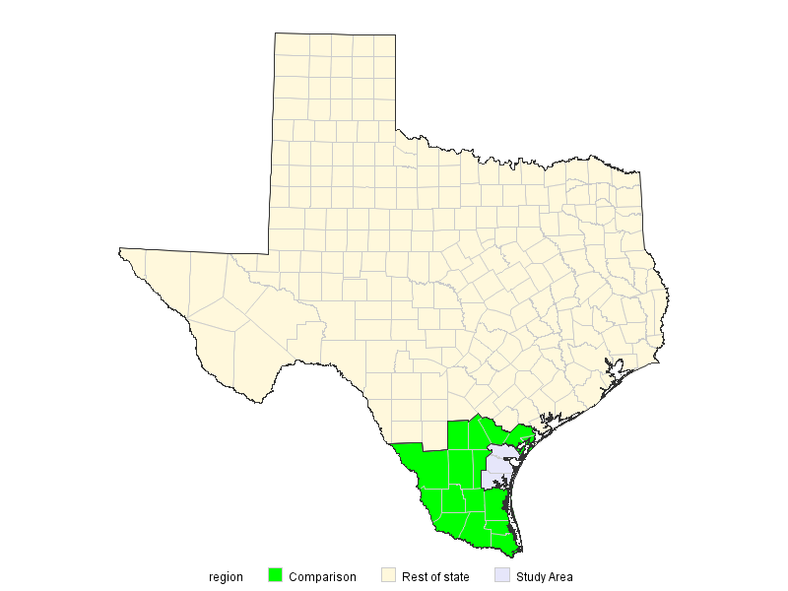
I'd like to create a Texas map with three colors: one for a study area, one for a comparison region, and one for the rest of Texas.
A colleague shared the following code (below) we've been trying to modify, and we are close, but it seems to only be generating the colors for study area and comparison region (I've mistakenly removed the rest of Texas). A thin black border around the state would be nice too.
Thanks for the help,
Taylor
data texas;
set maps.county;
if state in (48);
if state eq 48 then do;
if county in (355,273, 409) then region='Study Area';
if county in (505,489,479,427,391,311,297,261,249,247,215,131,61,47,25,7) then region='Comparison';
else region='Rest of state'; */
end;
run;
proc gproject
data=texas out=texas;
id state county;
run;
proc gremove data=texas out=border;
by state;
id county;
run;
proc sort data=border; by region /*segment*/; run;
data annoreg;
set border;
by region /*segment*/;
retain
size 4
color 'black'
xsys '2'
ysys '2'
when 'a';
/* For first point in each polygon or first */
/* point of interior polygon, set FUNCTION */
/* to 'POLY'. */
/* if first.segment or (lag(x)=. and lag(y)=.)
then function='POLY ';
/* For other points, set FUNCTION to 'POLYCONT'. */
/*else function='POLYCONT';
/* Don't output points with missing values. */
/*if x and y then output;*/
run;
/* Add the title */
title1 'Map of Study Area';
/* Create the map, using the Annotate facility to */
/* draw state and region outlines. */
proc gmap map=texas data=texas anno=annoreg;
id state county;
choro region / coutline=white legend=legend1;
legend1 shape=bar(4,3) pct across=5 frame
cshadow=black label=none;
run;
quit;
Accepted Solutions
- Mark as New
- Bookmark
- Subscribe
- Mute
- RSS Feed
- Permalink
- Report Inappropriate Content
In a pattern statement, you can specify just about any color you want. Here are the two techniques I use most frequently:
There are the SAS color nicknames. For example, color=red, or color=vpapb (very pale purplish blue). You can see the nicknames of by hovering your mouse over the color-chips in this example:
http://robslink.com/SAS/democd26/colors.htm
And you can also specify the rgb hex code for colors, using the format color=CXrrggbb (for example, 'CXff0000' for red).
- Mark as New
- Bookmark
- Subscribe
- Mute
- RSS Feed
- Permalink
- Report Inappropriate Content
You're missing one region, because you left out an 'else' in your if-then-else.
Here's some code that should produce a map like you're wanting...
data texas_map; set mapsgfk.us_counties (where=(statecode='TX'));
original_order=_n_;
length Region $50;
if county in (355,273, 409) then region='Study Area';
else if county in (505,489,479,427,391,311,297,261,249,247,215,131,61,47,25,7) then region='Comparison';
else region='Rest of state';
run;
data texas_data; set mapsgfk.us_counties_attr (where=(statecode='TX'));
length Region $50;
if county in (355,273, 409) then region='Study Area';
else if county in (505,489,479,427,391,311,297,261,249,247,215,131,61,47,25,7) then region='Comparison';
else region='Rest of state';
end;
proc gproject data=texas_map out=texas_map latlong eastlong degrees dupok;
id state county;
run;
proc sort data=texas_map out=texas_map;
by region county segment original_order;
run;
proc gremove data=texas_map out=region_map;
by region;
id county;
run;
data region_border; set region_map;
by region segment;
length function $8;
xsys='2'; ysys='2'; hsys='3'; when='a';
color='gray33';
if first.region or first.segment then function='poly';
else function='polycont';
run;
goptions reset=pattern;
pattern1 v=s color=lime;
pattern2 v=s color=cornsilk;
pattern3 v=s color=lavender;
legend1 shape=bar(.15in,.15in);
proc gmap data=texas_data map=texas_map all anno=region_border;
id county;
choro region / legend=legend1 coutline=graycc;
run;
- Mark as New
- Bookmark
- Subscribe
- Mute
- RSS Feed
- Permalink
- Report Inappropriate Content
Thank you so much.
I noticed you added this section dictating colors:
goptions reset=pattern;
pattern1 v=s color=lime;
pattern2 v=s color=cornsilk;
pattern3 v=s color=lavender;
legend1 shape=bar(.15in,.15in);
Can you tell me where I can finding a listing of what colors are available in the color repository?
Thank you.
- Mark as New
- Bookmark
- Subscribe
- Mute
- RSS Feed
- Permalink
- Report Inappropriate Content
In a pattern statement, you can specify just about any color you want. Here are the two techniques I use most frequently:
There are the SAS color nicknames. For example, color=red, or color=vpapb (very pale purplish blue). You can see the nicknames of by hovering your mouse over the color-chips in this example:
http://robslink.com/SAS/democd26/colors.htm
And you can also specify the rgb hex code for colors, using the format color=CXrrggbb (for example, 'CXff0000' for red).
- Mark as New
- Bookmark
- Subscribe
- Mute
- RSS Feed
- Permalink
- Report Inappropriate Content
Learn how use the CAT functions in SAS to join values from multiple variables into a single value.
Find more tutorials on the SAS Users YouTube channel.
SAS Training: Just a Click Away
Ready to level-up your skills? Choose your own adventure.


