- Home
- /
- Programming
- /
- Graphics
- /
- Create graph with 2 scales (left and right) using SGPanel
- RSS Feed
- Mark Topic as New
- Mark Topic as Read
- Float this Topic for Current User
- Bookmark
- Subscribe
- Mute
- Printer Friendly Page
- Mark as New
- Bookmark
- Subscribe
- Mute
- RSS Feed
- Permalink
- Report Inappropriate Content
Does anyone know how to plot left and right axes with different scales using SGpanel?
I saw an example with SGplot, but I need sgpanel to create 4 plots in a row.
Ideally I would have:
Plot 1 (left) with left y-axis say in %, Plot 2 (mid left) with no y-axis, Plot 3 (mid right) with no y-axis, and Plot 4 (right) with right axis in say meters.
Thanks much!
- Mark as New
- Bookmark
- Subscribe
- Mute
- RSS Feed
- Permalink
- Report Inappropriate Content
SG Procedures are meant to support the common 80-20 use cases. Your requirement for a panel graph with separate Y and Y2 axis goes beyond its scope.
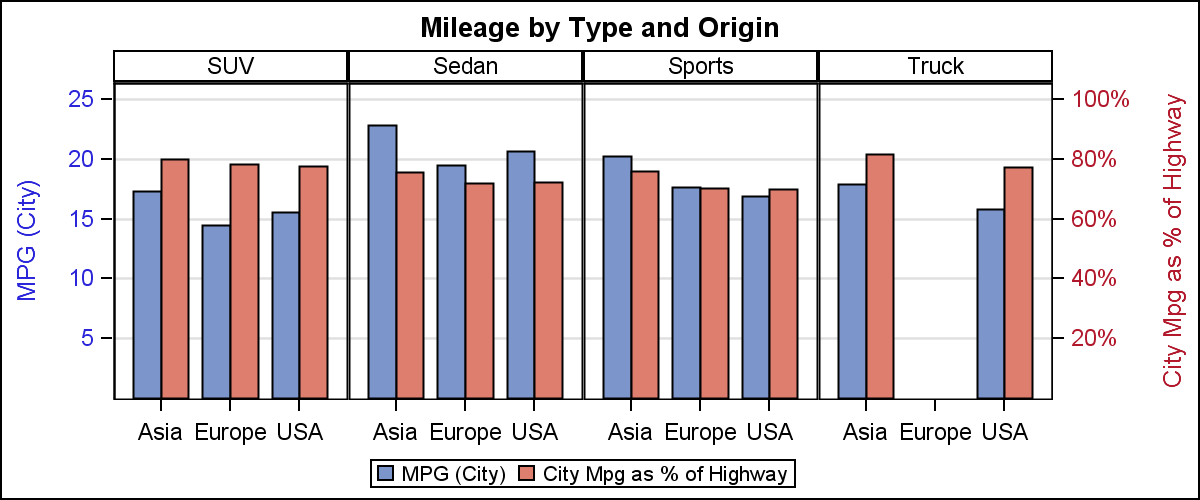
GTL does support such graphs and here is an example using data modified from sashelp.class with a % format for the right axis. Code is attached. I have also customized the axes to allow grid lines and color coding. BarChart in Layout Prototype will support summarization of data by category. For other plot types, you can use proc means to compute the summarized data.

Learn how use the CAT functions in SAS to join values from multiple variables into a single value.
Find more tutorials on the SAS Users YouTube channel.
SAS Training: Just a Click Away
Ready to level-up your skills? Choose your own adventure.


