- Home
- /
- Programming
- /
- Graphics
- /
- Create Maps from US Zipcode Lat/Longs
- RSS Feed
- Mark Topic as New
- Mark Topic as Read
- Float this Topic for Current User
- Bookmark
- Subscribe
- Mute
- Printer Friendly Page
- Mark as New
- Bookmark
- Subscribe
- Mute
- RSS Feed
- Permalink
- Report Inappropriate Content
Hi there, I am wondering if it is possible to use a table of US zipcode lat/longs to create a map in SAS using PROC GMAP. I realize there are US state/county maps, as well as a specific zip code reference file, but I have some custom regions that I would like to display and the only way I can access the GIS information is via zip code lat/longs (This would be similar to rolling up zip codes into US Senate districts). I currently complete this task using another GIS system and then using proc mapimport, but keeping it all in SAS would be much more efficient and allow for regular updates.
I'm using the code below, though I think I have a problem with my X/Y conversion or the sorting of the table. I've also attached a sample data file for just Utah zip codes that demonstrates the data structure (this would be the zipcode table in the first data statement). Any assistance is greatly appreciated. Thanks!
data addXY;
set zipcode;
x=atan(1)/45 * longitude;
y=atan(1)/45 * latitude;
run;
proc greduce data=addXY out=map_reduced;
id region;
run;
proc sort data=map_reduced; by region; run;
proc gproject data=map_reduced out=map_proj eastlong degrees;
id Region;
run;
ods listing close;
goptions reset=all;
ods html path = '.' (url=none) file='TestZip.html' style=sasweb;
ods html newfile=output;
goptions hsize=15in vsize=10in;
goptions xpixels=250 ypixels=250;
proc gmap data=map_proj map=map_proj all density=low;
id region;
choro region / nolegend;
run;
quit;
ODS HTML CLOSE;
ODS LISTING;
- Mark as New
- Bookmark
- Subscribe
- Mute
- RSS Feed
- Permalink
- Report Inappropriate Content
If I understand your goal, these are the steps I think you need to do:
- import zipcode shapefiles into SAS using PROC MAPIMPORT
After import, you will convert these lat / long coordinates to x/y using atan using code. IMPORTANT – for GMAP, the longitude coordinates for the western hemisphere need to be positive. So you may need to use abs() to convert long from negative to positive.
2. merge zipcode shapefile with dataset that identifies zipcodes with regions
If there are zipcodes that are not associated with special regions, you will still need to assign them unique region numbers. Otherwise the unassigned zipcodes will be reduced into one mega-region in the PROC GREDUCE.
3. do PROC GREDUCE based on region
4. do PROG GPROJECT
5. create choropleth map with PROC GMAP
Hope this helps.
- Mark as New
- Bookmark
- Subscribe
- Mute
- RSS Feed
- Permalink
- Report Inappropriate Content
The ZIP Codes are points and you are trying to draw polygons with them.
They likely overlap and such.
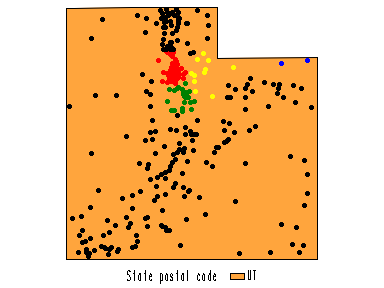
Maybe a better way would be to draw the points as colors. I am using annotate. In my example, I only use 4 colors and black for the rest but you can add as many colors as you need.

Here is the program:
%make_dots(annodata, zipcode, 'red');
data annodata; set annodata; x=long; y=lat;
if region=1 then color='red';
else if region=2 the color='yellow';
else if region=3 the color='blue';
else if region=4 the color='green';
/*etc*/
else color='black';
run;
data utah; set mapsgfk.us_states (where=(statecode="UT")); x=long; y=lat; run;
proc gmap data=utah map=utah anno=annodata; id statecode ; choro statecode; run;
The macro is here:
%macro make_dots(annodata, inputdata, color, size, tipvar);
data &annodata;
length function color $ 8 style $20 position $ 1 text $ 60 html $1024;
retain xsys ysys '2' hsys '3' when 'a' size .7;
set &inputdata;
/*optional arguments*/
%if (&size ^= ) %then %do;
size=&size;
%end;
/* All annotate points are 360-degree pies. */
function='pie';
rotate=360;
style='psolid';
color=&color;
/* optional tool tips */
%if (&tipvar ^= ) %then %do;
html= 'title=' || quote("&tipvar" ||'=' || trim(left(&tipvar)) );
%end;
output;
/* Draw an outline around each 'dot' */
color="gray55"; style='pempty';
output;
run;
%mend;
- Mark as New
- Bookmark
- Subscribe
- Mute
- RSS Feed
- Permalink
- Report Inappropriate Content
If you have acceptable levels from you current GIS I would try creating a map dataset with the polygons for each zip code to import into SAS. One recurring issue, especially with western states is that many existing Zip code map sets have large gaps of geography not associated with any zip. Or at least that was my experience starting with available Census boundary sets.
Learn how use the CAT functions in SAS to join values from multiple variables into a single value.
Find more tutorials on the SAS Users YouTube channel.
SAS Training: Just a Click Away
Ready to level-up your skills? Choose your own adventure.


