- Home
- /
- Programming
- /
- Graphics
- /
- Count labels on maps
- RSS Feed
- Mark Topic as New
- Mark Topic as Read
- Float this Topic for Current User
- Bookmark
- Subscribe
- Mute
- Printer Friendly Page

- Mark as New
- Bookmark
- Subscribe
- Mute
- RSS Feed
- Permalink
- Report Inappropriate Content
I feel after searching this is likely either a really simple "no it's not possible" question, or a "did he just ask that?" question. Apologies if this is a smiple miss, but it's a small item that I can't seem to find and a big impact on how my company is able to view data and potentially use/purchase the software.
When mapping via the graph builder I have been unable to find out how I place a count label over each state. In doing a negative equity analysis I am trying to figure out how I can identify the number of data points used per state is shown on each state. This was I can see which states become larger impacts on my averages. It seems like a simple visual option, but I just don't see how I get my states to identify there is 7 making up MN and 5 making up TX, as examples.

- Mark as New
- Bookmark
- Subscribe
- Mute
- RSS Feed
- Permalink
- Report Inappropriate Content
Are you using SAS/Graph Proc Gmap? (or SAS/GIS, or SAS Visual Analytics, or other?)
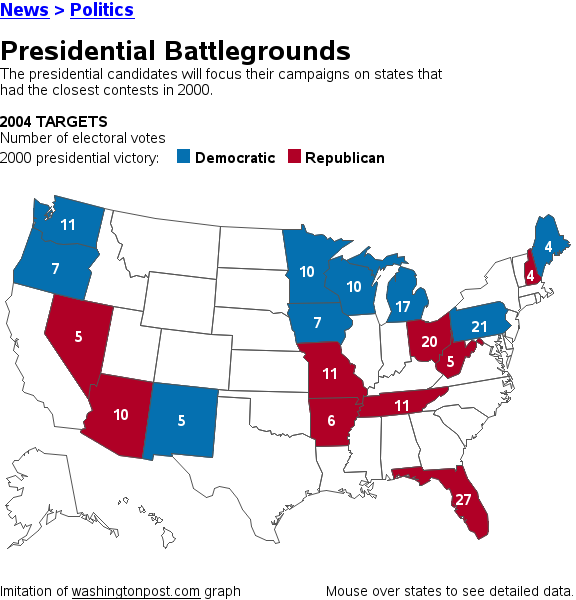
If using SAS/Graph Proc Gmap, you can programmatically annotate text values on a map.
Here's an example of 1 way to do it:
http://robslink.com/SAS/democd4/battle.htm
http://robslink.com/SAS/democd4/battle_info.htm
- Mark as New
- Bookmark
- Subscribe
- Mute
- RSS Feed
- Permalink
- Report Inappropriate Content
I'm not actually sure what I am using, it's the default mapping withing the Graph Builder of standard JMP trial version. For simplicity, what I have is 6 lines of data making up an average of negative equity for the state of MN. The gradient shows where MN falls as a comparative average, now I'd like to add the count of '6' to the MAP to show the number of files making that up.
- Mark as New
- Bookmark
- Subscribe
- Mute
- RSS Feed
- Permalink
- Report Inappropriate Content
You'll want to post that one in the JMP forum! ![]()
https://communities.sas.com/community/support-communities/jmp_software

- Mark as New
- Bookmark
- Subscribe
- Mute
- RSS Feed
- Permalink
- Report Inappropriate Content
You can use an annotate dataset. There's some documentation on the PROC GMAP.
.jpg")
Catch up on SAS Innovate 2026
Nearly 200 sessions are now available on demand with the SAS Innovate Digital Pass.
Explore Now →Learn how use the CAT functions in SAS to join values from multiple variables into a single value.

Find more tutorials on the SAS Users YouTube channel.
SAS Training: Just a Click Away
Ready to level-up your skills? Choose your own adventure.
-
4 replies
-
04-30-2013 12:36 PM
-
3519 views
-
0 likes
-
3 in conversation
-
