- Home
- /
- Programming
- /
- Graphics
- /
- Convert the Consort Diagram from RTF to PNG
- RSS Feed
- Mark Topic as New
- Mark Topic as Read
- Float this Topic for Current User
- Bookmark
- Subscribe
- Mute
- Printer Friendly Page

- Mark as New
- Bookmark
- Subscribe
- Mute
- RSS Feed
- Permalink
- Report Inappropriate Content
Dear Expert,
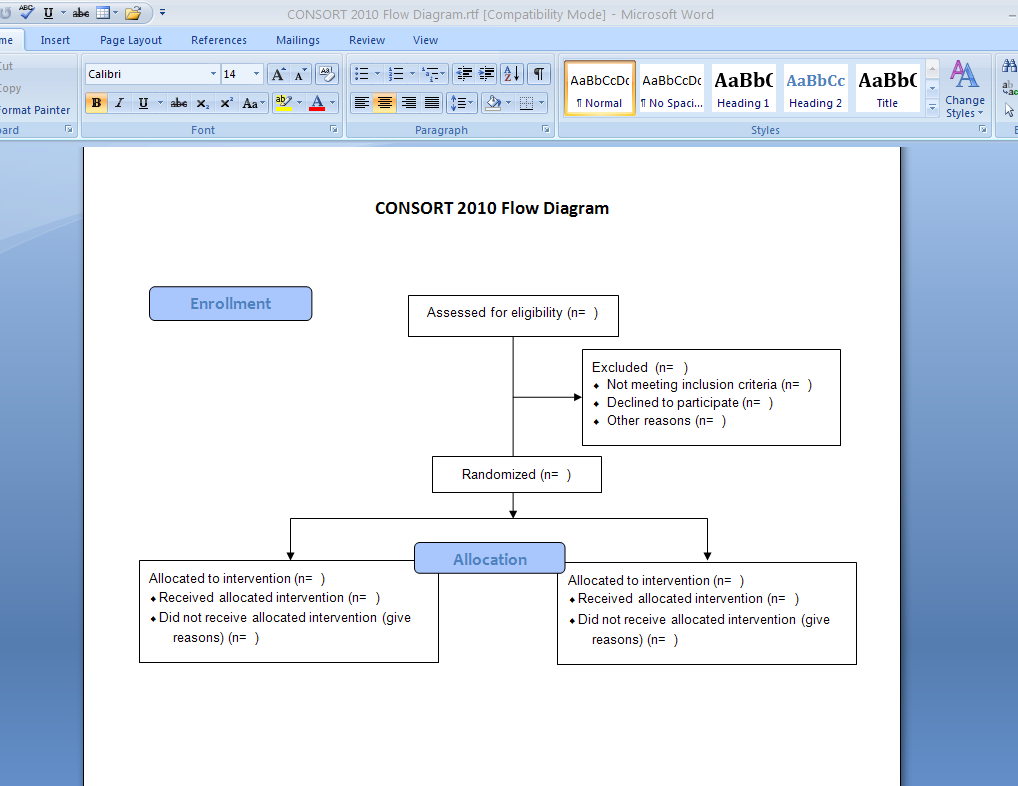
I would like to know your suggestions on converting the RTF file into PNG file. I am unable to attach teh rtf file, so i am sharing the screenshot of the rtf file.
I tried the conversion using proc gprint procedure, however a graphic file is generated with the RTF code but not the image.
Please let me know if there is any way to achieve this, i am working on sas 9.3. Appreciate your responses.
Thanks,
Jag
Jag

- Mark as New
- Bookmark
- Subscribe
- Mute
- RSS Feed
- Permalink
- Report Inappropriate Content
SAS/GRAPH(R) 9.2: Reference, Second Edition
Second section. I would also move to sgplot or GTL.

- Mark as New
- Bookmark
- Subscribe
- Mute
- RSS Feed
- Permalink
- Report Inappropriate Content
I doubt you can use the same code to switch your process from RTF to PNG, most likely it will be a redesign.
You'd have to show what type of code you're using, but I'm guessing that you're using something like in this paper:
http://www.wuss.org/proceedings11/Papers_Carpenter_A_74920.pdf
You may want to look into export the RTF file into PDF or PNG from Word via DDE if you want to avoid the redesign process.
- Mark as New
- Bookmark
- Subscribe
- Mute
- RSS Feed
- Permalink
- Report Inappropriate Content
Yes Reeza you guessed it right, i referred to the same article and generated the RTF file, however i want the output in image file. would you like to share any articles which have this information.
I will try exporting of RTF to PNG. The only way this is making it difficult is that i am unable to use any graphic options as i am not using any graph procedures to generate the output.
Thanks,
Jag
Jag
- Mark as New
- Bookmark
- Subscribe
- Mute
- RSS Feed
- Permalink
- Report Inappropriate Content
I took a quick look into the converting Word into PNG and it didn't seem to be straightforward either - it seems to be that you would have to convert it to PDF then PNG
Why the need for PNG?
Unfortunately I have no idea how to do this via SAS using Graph Procedures.
In any case this may be a situation of not using the right tool for the right job, i.e. SAS may not be the right tool. The way I've done it historically was to generate the templates in Excel, export to excel and then convert to PDF. I've never had the need to generate a PNG though....

- Mark as New
- Bookmark
- Subscribe
- Mute
- RSS Feed
- Permalink
- Report Inappropriate Content
If you're on Windows, you could always use Windows' snippingtool. One of its save options is PNG.

- Mark as New
- Bookmark
- Subscribe
- Mute
- RSS Feed
- Permalink
- Report Inappropriate Content
FYI...If you are using SAS9.4M2 or later, you can use the POLYGON plot to create such flow diagrams using SGPLOT procedure.

- Mark as New
- Bookmark
- Subscribe
- Mute
- RSS Feed
- Permalink
- Report Inappropriate Content
Sanjay, do you have an example of using a POLYGON plot to generate a consort diagram (or something vaguely similar)? I have just started working on the topic of how to generate consort diagrams using SGPLOT and any leg up you could give me would be much appreciated. Thanks!
- Mark as New
- Bookmark
- Subscribe
- Mute
- RSS Feed
- Permalink
- Report Inappropriate Content
Hi Shane. As I recall you were attempting to use the feedback "Outfile" option of the TEXT plot to get the size of the text box to determine the layout. That is quite a sophisticated approach.
I posted a simpler solution today. Hope that can help too.
http://blogs.sas.com/content/graphicallyspeaking/2016/10/20/outside-box-consort-diagram/
- Mark as New
- Bookmark
- Subscribe
- Mute
- RSS Feed
- Permalink
- Report Inappropriate Content
Sanjay,
I will definitely review the code to see what I can borrow to make my own macro simpler.
Thanks!
.jpg")
Catch up on SAS Innovate 2026
Nearly 200 sessions are now available on demand in the Innovate Hub.
Watch Now →Learn how use the CAT functions in SAS to join values from multiple variables into a single value.

Find more tutorials on the SAS Users YouTube channel.
SAS Training: Just a Click Away
Ready to level-up your skills? Choose your own adventure.
-
9 replies
-
03-18-2015 11:55 AM
-
5177 views
-
0 likes
-
6 in conversation
-
