- Home
- /
- Programming
- /
- Graphics
- /
- Co-ordinate system for PIE- and STAR-charts in GCHART
- RSS Feed
- Mark Topic as New
- Mark Topic as Read
- Float this Topic for Current User
- Bookmark
- Subscribe
- Mute
- Printer Friendly Page

- Mark as New
- Bookmark
- Subscribe
- Mute
- RSS Feed
- Permalink
- Report Inappropriate Content
The STAR-chart in PROC GCHART does not draw lines from the origin to the points on the enclosing circle. I did not find an option to include such lines. Therefore I am trying to draw these radial lines with Annotate. However, so far I was not able to pick up the location of the origin (center) nor the radius of the enclosing circle. Any suggestion how to do that?

- Mark as New
- Bookmark
- Subscribe
- Mute
- RSS Feed
- Permalink
- Report Inappropriate Content
Are you just looking for how to include the lines (e.g., the noconnect option) or combining the two? If it is the former, take a look at: http://support.sas.com/documentation/cdl/en/graphref/63022/HTML/default/viewer.htm#gr13n15-ex.htm
- Mark as New
- Bookmark
- Subscribe
- Mute
- RSS Feed
- Permalink
- Report Inappropriate Content
No, that is not what I want.
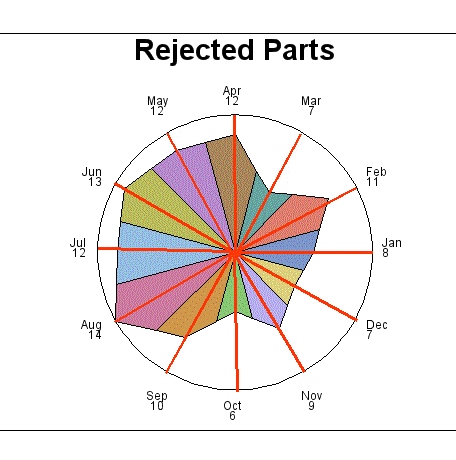
Below is the first picture of that article. I added the lines that I want in RED. The run from the center to each of the midpoint markers on the enclosing circle. In addition to the lines I also want to add tickmarks to the lines, but I suppose that when I am able to create the lines adding the tickmarks is not a major problem.

- Mark as New
- Bookmark
- Subscribe
- Mute
- RSS Feed
- Permalink
- Report Inappropriate Content
You may want to investigate GRADAR as it does the spokes and allows ticks on them. There are differences in how groups are displayed but without data examples it's hard to tell if that'll work.
- Mark as New
- Bookmark
- Subscribe
- Mute
- RSS Feed
- Permalink
- Report Inappropriate Content
That would be an option in some situations, but the challenge remains: how do I get the right co-ordinates for the various points in a STAR-chart. Although drawin radial lines is probably not very relevant to PIE-charts, the general problem how to position annotate elements in PIE- and START-charts remain.
- Mark as New
- Bookmark
- Subscribe
- Mute
- RSS Feed
- Permalink
- Report Inappropriate Content
Erik,
proc gchart and annotate are definitely not amongst my specialties, thus you may want to simply disregard what I have to say regarding your problem. I came awfully close to producing what you want, but in a rather odd and incomplete way. However, as you haven't received an answer yet, I figure I may at least share the method .. as forceful and incomplete as it is. Hopefully, minimally, you might be able to use it to help discover what you are missing.
data meetings;
informat date mmddyy10.;
format date mmddyy10.;
input (Dept Room) ($) Room_Number Date Hours;
cards;
ACCOUNTS C339 339 01/10/1995 1.00
ACCOUNTS B100 100 01/24/1995 0.50
SHIP C339 339 01/30/1995 2.00
MARKET C301 301 02/24/1995 3.50
SHIP C339 339 02/28/1995 4.00
MARKET C301 301 03/01/1995 4.00
ACCOUNTS B100 100 03/03/1995 3.50
ACCOUNTS B100 100 03/08/1995 0.50
ACCOUNTS B100 100 03/21/1995 0.25
SHIP C301 301 03/27/1995 1.50
ACCOUNTS C301 301 03/29/1995 0.50
SHIP C339 339 04/12/1995 0.50
MARKET C301 301 04/25/1995 1.50
MARKET B100 100 05/02/1995 0.50
SHIP C301 301 05/12/1995 2.50
MARKET C301 301 05/25/1995 3.50
SHIP C301 301 06/01/1995 2.00
SHIP C339 339 06/07/1995 3.00
SHIP C301 301 06/14/1995 2.00
MARKET C339 339 07/12/1995 0.50
ACCOUNTS B100 100 08/03/1995 3.00
SHIP C301 301 08/14/1995 2.50
SHIP C339 339 08/28/1995 1.50
MARKET C339 339 09/15/1995 3.00
ACCOUNTS C301 301 09/28/1995 0.50
MARKET C301 301 10/11/1995 3.00
SHIP C301 301 11/01/1995 1.50
MARKET C339 339 11/15/1995 1.00
SHIP B100 100 11/21/1995 2.00
SHIP C339 339 11/22/1995 3.50
MARKET C339 339 12/05/1995 2.50
MARKET C301 301 12/21/1995 2.50
;
proc summary data=meetings;
var hours;
class room;
output out=props n=;
run;
data props;
set props;
retain total;
if _n_ eq 1 then total=hours;
else do;
prop=total/hours;
output;
end;
run;
proc sql;
create table meetings2 as
select a.*,b.prop
from meetings as a,
props as b
having a.room eq b.room
;
quit;
goptions nodisplay htext=13pt htitle=15pt;
/* SLICE STAR CHART */
pattern1 color=graydd; pattern2 color=VLIB;
pattern3 color=PALG;
title1 "Lengths of Meetings by Room";
proc gchart data=meetings2;
star room / noheading name="starA"
sumvar=hours fill=s coutline=black woutline=1;
run; quit;
/* SPINE STAR CHART */
proc gchart data=meetings2;
star room / noheading name="starB"
sumvar=prop fill=x noconnect
/* percent=none value=none*/
ctext=white
coutline=red woutline=1;
run; quit;
filename chrt34 'c:\art\chrt34.emf';
goptions display gsfname=chrt34 gsfmode=replace;
proc greplay nofs igout=work.gseg tc=tempCat;
tdef T1X1
1/llx=0 ulx=0 urx=100 lrx=100
lly=0 uly=100 ury=100 lry=0;
template=T1X1;
treplay 1:StarA 1:StarB;
run; quit;
- Mark as New
- Bookmark
- Subscribe
- Mute
- RSS Feed
- Permalink
- Report Inappropriate Content
Art,
I see what you do. And yes this may work, provided that you keep the graphics environment equal, in order to keep the size and position of the two charts that you are stacking identical. But what about adding other elements to a PIE or START chart. I assume there must be some method in the Annotate facility to find the right co-ordinates of the center and the radius of the enclosing circle?!
- Mark as New
- Bookmark
- Subscribe
- Mute
- RSS Feed
- Permalink
- Report Inappropriate Content
Erik, I will have to leave your question for someone who is more familiar with SAS/graph and annotate than I am. I produced my pseudo solution to your problem this morning, but didn't post it as I was hoping that some "real" graph experts my provide the "real" answer.
Unfortunately, you may have to wait until after the holidays, which is why I decided to share my feeble attempt.
- Mark as New
- Bookmark
- Subscribe
- Mute
- RSS Feed
- Permalink
- Report Inappropriate Content
Art,
Much appreciated!
It can wait for some time. There are several other topics I can work on.
Best wishes for 2012 to you and any other reader of this.
- Mark as New
- Bookmark
- Subscribe
- Mute
- RSS Feed
- Permalink
- Report Inappropriate Content
Has anybody a suggestion?

- Mark as New
- Bookmark
- Subscribe
- Mute
- RSS Feed
- Permalink
- Report Inappropriate Content
hi ... the big problem with using annotate to modify a star chart is that the data coordinate system cannot be used, so you'd have to figure out the locations of anything that has to be tweaked based on percentages of output area and that'll vary from chart to chart
so, Art's overlay solution is a lot easier than annotate (but pretty limited as to what you can accomplish)
.jpg")
Catch up on SAS Innovate 2026
Nearly 200 sessions are now available on demand with the SAS Innovate Digital Pass.
Explore Now →Learn how use the CAT functions in SAS to join values from multiple variables into a single value.

Find more tutorials on the SAS Users YouTube channel.
SAS Training: Just a Click Away
Ready to level-up your skills? Choose your own adventure.
-
10 replies
-
12-30-2011 05:21 AM
-
5906 views
-
0 likes
-
4 in conversation
-
