- Home
- /
- Programming
- /
- Graphics
- /
- Re: Changing Main Title for Fit Plot in Proc GLM
- RSS Feed
- Mark Topic as New
- Mark Topic as Read
- Float this Topic for Current User
- Bookmark
- Subscribe
- Mute
- Printer Friendly Page
- Mark as New
- Bookmark
- Subscribe
- Mute
- RSS Feed
- Permalink
- Report Inappropriate Content
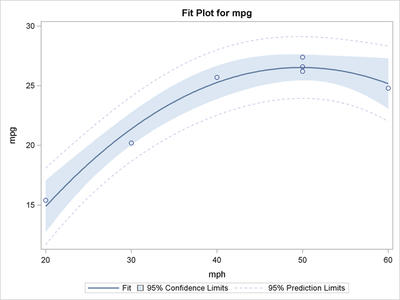
I sincerely hope this question has not been posted already since I do hate wasting the time of others. With that said, how do I change the Main Title in the fit plot produced by PROC GLM. For example, in the plot below, how do I change "Fit Plot for mpg" to lets say "Fit plot for Miles per Gallon". As far as I know, changing the label for the variable will not do this.
Accepted Solutions
- Mark as New
- Bookmark
- Subscribe
- Mute
- RSS Feed
- Permalink
- Report Inappropriate Content
You would normally need to play with the graph template. I find it less trouble to OUTPUT the predicted and limit values and produce my own graph with SGPLOT. But in this case, you could get away with a renaming the variable to a literal name:
option validvarname=any;
proc glm data=sashelp.cars(rename=mpg_city='Miles Per Gallon'n) plots(only)=fitplot;
model 'Miles Per Gallon'n = horsepower;
run;- Mark as New
- Bookmark
- Subscribe
- Mute
- RSS Feed
- Permalink
- Report Inappropriate Content
Wow that's crazy. I didn't realize you could change variable names to literal ones. I would also like to add that variable names are still limited to 32 characters which would also limit the title length using the above method.
- Mark as New
- Bookmark
- Subscribe
- Mute
- RSS Feed
- Permalink
- Report Inappropriate Content
You could change the template for the Fit plot (Stat.GLM.Graphics.Fit).
The change would be to modify the line:
entrytitle _TITLE " for " _DEPNAME;
to
entrytitle _TITLE " for " _DEPLABEL;
to use the dependent variable label in the title.
- Mark as New
- Bookmark
- Subscribe
- Mute
- RSS Feed
- Permalink
- Report Inappropriate Content
Dear PGstats,
I thank you in advance for you time and help.
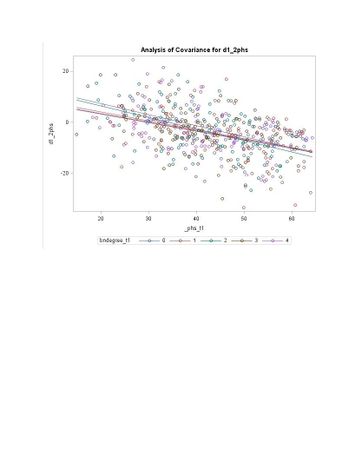
In my case, I am looking to output from proc glm to proc template (or proc sgplot). Alternatively, if I cannot, I want to change: 1) Title of the graph to 'Analysis of covariance for Differences in HS'; the X Title to '2006HS'; 3) the Y Title to '2009HS'; and to re-grading into 5 intervals.
Best regards,
Phan S.
- Mark as New
- Bookmark
- Subscribe
- Mute
- RSS Feed
- Permalink
- Report Inappropriate Content
There is a macro for changing graph titles.
- Mark as New
- Bookmark
- Subscribe
- Mute
- RSS Feed
- Permalink
- Report Inappropriate Content
Thank you so much for your prompt help, although I got lost at and thereafter entrytitle _TITLE
Everything become red syntax
ods graphics on;
%let Graphics_AnomPlot2 = My Second Title;
proc logistic data=Neuralgia;
ods select anomplot;
class Treatment Sex / param=glm;
model Pain= Treatment|Sex Age;
lsmeans Treatment / plots=anom;
run;
* Suppress both titles.;
%let Graphics_AnomPlot = ;
%let Graphics_AnomPlot2 = ;
proc logistic data=Neuralgia;
ods select anomplot;
class Treatment Sex / param=glm;
model Pain= Treatment|Sex Age;
lsmeans Treatment / plots=anom;
run;
my Trouble thereafter the below------------------
entrytitle _TITLE;
entrytitle textattrs=GRAPHVALUETEXT _CLSTR;
mvar Graphics_AnomPlot Graphics_AnomPlot2;
if (EXISTS(GRAPHICS_ANOMPLOT))
entrytitle GRAPHICS_ANOMPLOT;
else
entrytitle _TITLE;
endif;
if (EXISTS(GRAPHICS_ANOMPLOT2))
entrytitle GRAPHICS_ANOMPLOT2;
else
entrytitle textattrs=GRAPHVALUETEXT _CLSTR;
endif;
%grtitle;
%grtitle(path=stat);
%grtitle(path=stat.logistic);
proc template; list / store=work.templat; quit;
- Mark as New
- Bookmark
- Subscribe
- Mute
- RSS Feed
- Permalink
- Report Inappropriate Content
The entrytitle part explains how things work. You don't submit them. You have to read the what to do part and follow those instructions. If you continue into the how it works section you have to realize that code that is shown is not necessarily designed for you to submit.
April 27 – 30 | Gaylord Texan | Grapevine, Texas
Registration is open
Walk in ready to learn. Walk out ready to deliver. This is the data and AI conference you can't afford to miss.
Register now and save with the early bird rate—just $795!
Learn how use the CAT functions in SAS to join values from multiple variables into a single value.
Find more tutorials on the SAS Users YouTube channel.
SAS Training: Just a Click Away
Ready to level-up your skills? Choose your own adventure.


