- Home
- /
- Programming
- /
- Graphics
- /
- Re: Changing Color of Area and Blocks
- RSS Feed
- Mark Topic as New
- Mark Topic as Read
- Float this Topic for Current User
- Bookmark
- Subscribe
- Mute
- Printer Friendly Page

- Mark as New
- Bookmark
- Subscribe
- Mute
- RSS Feed
- Permalink
- Report Inappropriate Content
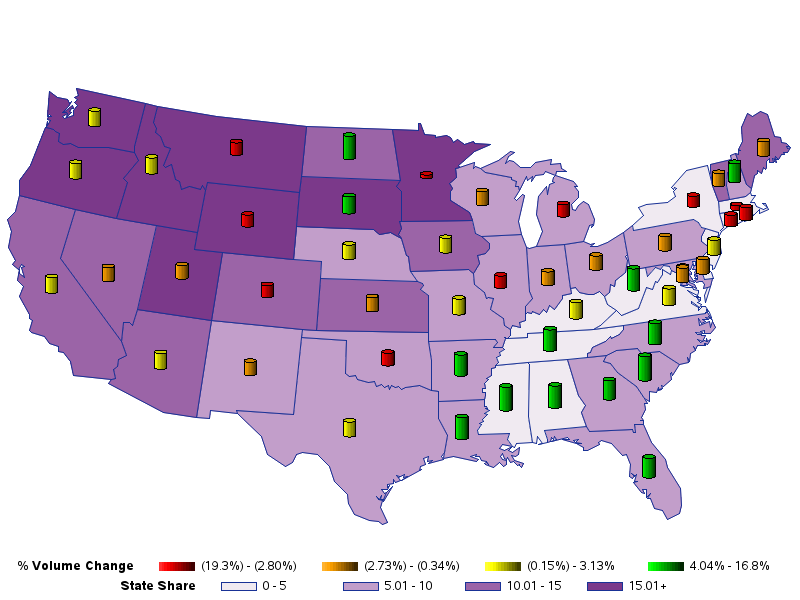
I'm working on a map which I'm trying to summarize the Total US with two variables, Volume and Share. Below is the SAS code I'm using to create the map. My issue is no matter what I try I can't change the purple color of the states themselves. Any advice?
GOPTIONS RESET=ALL;
LEGEND1 Label=("% Volume Change");
LEGEND2 Label=("State Share");
PATTERN1 VALUE=SOLID COLOR=RED;
PATTERN2 VALUE=SOLID COLOR=ORANGE;
PATTERN3 VALUE=SOLID COLOR=YELLOW;
PATTERN4 VALUE=SOLID COLOR=GREEN;
Proc GMAP Map=MAPS.US Data=Step_3;
Format Volume GRPFMT. Share SHRFMT.;
ID StateCode;
Block VOLUME / LEGEND = LEGEND1 LEVELS = 4 CBLOCK=BLACK SHAPE=C ;
Area SHARE / LEGEND = LEGEND2;
Run; Quit;

- Mark as New
- Bookmark
- Subscribe
- Mute
- RSS Feed
- Permalink
- Report Inappropriate Content
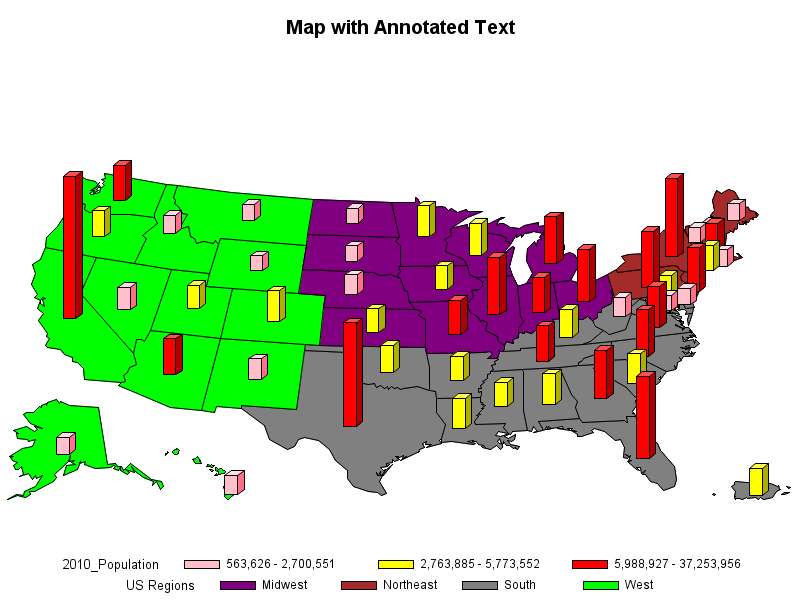
Here is one way to do it...
data my_map; set maps.us;
original_order=_n_;
run;
proc sql;
create table my_map as
select unique my_map.*, us_data.region
from my_map left join sashelp.us_data
on my_map.statecode=us_data.statecode
order by original_order;
quit; run;
/* colors for 3 'levels' (bar colors) */
pattern1 v=solid c=pink;
pattern2 v=solid c=yellow;
pattern3 v=solid c=red;
/* colors for the regions (map land area colors) */
pattern4 v=msolid c=purple;
pattern5 v=msolid c=brown;
pattern6 v=msolid c=gray;
pattern7 v=msolid c=cx00ff00;
proc gmap data=sashelp.us_data map=my_map;
id region statecode;
block population_2010 / levels=3 area=1;
run;
- Mark as New
- Bookmark
- Subscribe
- Mute
- RSS Feed
- Permalink
- Report Inappropriate Content
Thanks.
.jpg")
Catch up on SAS Innovate 2026
Nearly 200 sessions are now available on demand in the Innovate Hub.
Watch Now →Learn how use the CAT functions in SAS to join values from multiple variables into a single value.

Find more tutorials on the SAS Users YouTube channel.
SAS Training: Just a Click Away
Ready to level-up your skills? Choose your own adventure.
-
2 replies
-
02-12-2015 11:22 AM
-
2863 views
-
1 like
-
2 in conversation
-
