- Home
- /
- Programming
- /
- Graphics
- /
- Re: Annotating a stacked bar chart
- RSS Feed
- Mark Topic as New
- Mark Topic as Read
- Float this Topic for Current User
- Bookmark
- Subscribe
- Mute
- Printer Friendly Page
- Mark as New
- Bookmark
- Subscribe
- Mute
- RSS Feed
- Permalink
- Report Inappropriate Content
Hi
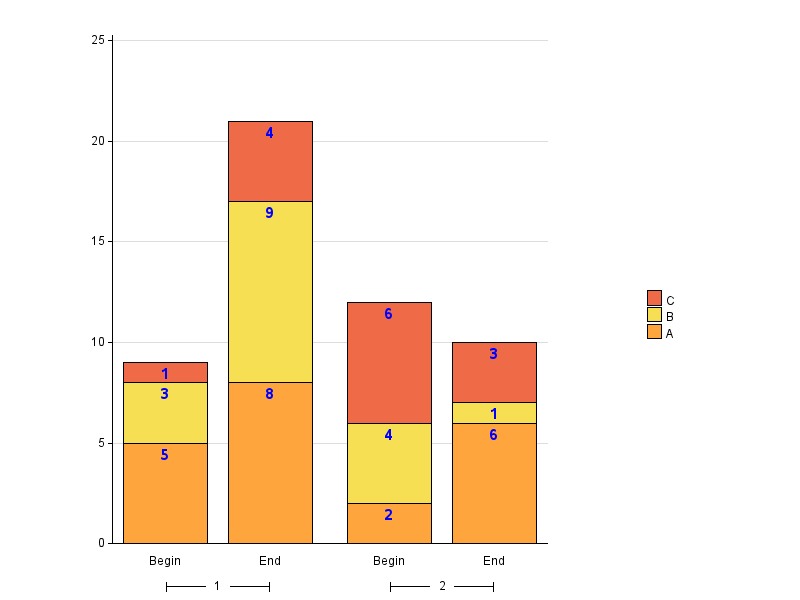
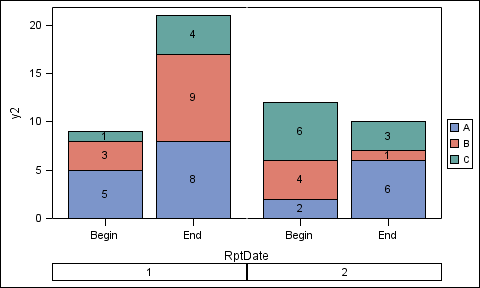
I am wanting to display the values of each segment within a stacked bar chart that is also grouped. I am having trouble understanding what is needed for the annotate dataset.
Below is my code to create a sample table, a annoate table and then create my graph. The graph creates as I want it to without the sganno option. I just need to be able to put the values i.e. numerator, in each of the segments on the stacked bar chart. Any help would be greatly appreciated or if I can do a stacked bar chart that is grouped with the labels any other way??
thanks
Tammy
data work.tam;
infile datalines dlm=',';
input Risk $ Numerator Service RptDate $;
datalines;
A,5,1,Begin
A,8,1,End
B,3,1,Begin
B,9,1,End
C,1,1,Begin
C,4,1,End
A,2,2,Begin
A,6,2,End
B,4,2,Begin
B,1,2,End
C,6,2,Begin
C,3,2,End
;
run;
data work.anno;
set work.tam;
retain function "text" xspace "datavalue";
label=put(numerator,comma10.);
yc1=strip(put(numerator,comma10.));
run;
proc sgpanel data=work.tam sganno=work.anno;
panelby service / layout=columnlattice onepanel noborder colheaderpos=bottom novarname;
vbar RptDate / response=Numerator group=Risk dataskin=pressed;
keylegend /position=right;
run;
- Mark as New
- Bookmark
- Subscribe
- Mute
- RSS Feed
- Permalink
- Report Inappropriate Content
Hi tammy
Since the annotate together with SGPANEL does not support a drawspace that supports "data",
this is from the doc:
| Restriction | For the SGPANEL and SGSCATTER procedures, only GRAPHPERCENT, GRAPHPIXEL, LAYOUTPERCENT, and LAYOUTPIXEL values are valid. |
You have to go another way, in a recent blog entry by outlined a technique with HIGHLOW and SCATTER plot to do something similar to what you want.Building on that, here is a code sample for the graph you want to do, it does some data preparation so that the HIGHLOW and SCATTER plots can be used. I guess there are other solutions as well
infile datalines dlm=',';
input Risk $ Numerator Service RptDate $;
key = catx("_", service, RptDate, risk );
datalines;
A,5,1,Begin
A,8,1,End
B,3,1,Begin
B,9,1,End
C,1,1,Begin
C,4,1,End
A,2,2,Begin
A,6,2,End
B,4,2,Begin
B,1,2,End
C,6,2,Begin
C,3,2,End
;
proc sort data=work.tam;
by key;
run;
data tam2;
set tam;
by service rptdate NOTSORTED;
length numLow numHigh 8;
retain numHigh;
if first.service = 1 or first.rptdate = 1 then do;
numlow = 0;
numHigh = numerator;
end;
else do;
numlow = numHigh;
numHigh = numLow + numerator;
end;
labelpos = numLow + (range(numLow, numHigh) / 2);
labelValue = range(numLow, numHigh);
run;
proc sgpanel data=work.tam2;
panelby service /
layout=columnlattice onepanel noborder colheaderpos=bottom novarname
;
highlow x=RptDate low=numlow high=numhigh /
group=Risk type=bar name="hl"
;
scatter x=rptDate y=labelpos /
datalabel=labelValue
datalabelpos=center
markerattrs=(size=0)
labelStrip
name="sc"
;
keylegend "hl" / position=right;
run;
- Mark as New
- Bookmark
- Subscribe
- Mute
- RSS Feed
- Permalink
- Report Inappropriate Content
If you can't do this conveniently in ODS Graphics, here's an alternative using SAS/Graph Gchart:
data work.tam;
infile datalines dlm=',';
input Risk $ Numerator Service RptDate $;
datalines;
A,5,1,Begin
A,8,1,End
B,3,1,Begin
B,9,1,End
C,1,1,Begin
C,4,1,End
A,2,2,Begin
A,6,2,End
B,4,2,Begin
B,1,2,End
C,6,2,Begin
C,3,2,End
;
run;
proc sort data=work.tam out=work.anno;
by service RptDate Risk;
run;
data work.anno; set work.anno;
by service RptDate;
if first.service or first.RptDate then y=0;
y+Numerator;
run;
data work.anno; set work.anno;
function='label'; position='e'; size=2.5; color='blue'; style='albany amt/bold';
xsys='2'; ysys='2'; hsys='3'; when='a';
group=service; midpoint=RptDate;
text=trim(left(put(numerator,comma10.)));
run;
legend1 label=none across=1 position=(right middle)
order=descending shape=bar(.15in,.15in) offset=(-15pct,0pct);
axis1 label=none;
axis2 label=none;
axis3 label=none order=(0 to 25 by 5) minor=none;
ods html style=sasweb;
proc gchart data=work.tam anno=work.anno;
vbar RptDate / type=sum sumvar=Numerator
subgroup=Risk group=service width=12
maxis=axis1 gaxis=axis2 raxis=axis3
noframe autoref clipref cref=graydd
legend=legend1;
run;

- Mark as New
- Bookmark
- Subscribe
- Mute
- RSS Feed
- Permalink
- Report Inappropriate Content
Brilliant - thanks so much Bruno and Robert! They both worked a treat.
- Mark as New
- Bookmark
- Subscribe
- Mute
- RSS Feed
- Permalink
- Report Inappropriate Content
Assuming you are using at least SAS 9.3. With SG, you can do this without annotation by overlaying a SCATTER with MARKERCHAR. Since SGPANEL VBARPARM does not support stacked groups at SAS 9.3, you can use HIGHLOW statement with TYPE=BAR. In addition to computing the label Y position, also compute the start and end of each segment as shown in the code.

data work.tam;
infile datalines dlm=',';
input Risk $ Numerator Service RptDate $;
datalines;
A,5,1,Begin
A,8,1,End
B,3,1,Begin
B,9,1,End
C,1,1,Begin
C,4,1,End
A,2,2,Begin
A,6,2,End
B,4,2,Begin
B,1,2,End
C,6,2,Begin
C,3,2,End
;
run;
proc sort data=tam out=tam1;
by service rptdate risk;
run;
data tam2;
set tam1;
by service rptdate risk;
retain y2;
if first.rptdate then do;
y1=0; y2=y1+numerator; ys=(y1+y2)/2;
end;
else do;
y1=y2; y2=y1+numerator; ys=(y1+y2)/2;
end;
run;
ods html close;
ods listing;
proc sgpanel data=tam2 ;
format numerator 1.;
panelby service / layout=columnlattice onepanel noborder colheaderpos=bottom novarname;
highlow x=RptDate low=y1 high=y2 / group=Risk type=bar name='a' lineattrs=(color=black);
scatter x=rptdate y=ys / markerchar=numerator markercharattrs=(size=9);
keylegend 'a' /position=right;
rowaxis offsetmin=0;
run;
- Mark as New
- Bookmark
- Subscribe
- Mute
- RSS Feed
- Permalink
- Report Inappropriate Content
Thanks so much Sanjay, and yes I'm using v9.4. I've been reading some of your white papers and blogs as well which have been very useful in understanding the SG procedures.
April 27 – 30 | Gaylord Texan | Grapevine, Texas
Registration is open
Walk in ready to learn. Walk out ready to deliver. This is the data and AI conference you can't afford to miss.
Register now and save with the early bird rate—just $795!
Learn how use the CAT functions in SAS to join values from multiple variables into a single value.
Find more tutorials on the SAS Users YouTube channel.
SAS Training: Just a Click Away
Ready to level-up your skills? Choose your own adventure.


