- Home
- /
- Programming
- /
- Graphics
- /
- Re: Adding superscript on yaxis values in proc gplot
- RSS Feed
- Mark Topic as New
- Mark Topic as Read
- Float this Topic for Current User
- Bookmark
- Subscribe
- Mute
- Printer Friendly Page
- Mark as New
- Bookmark
- Subscribe
- Mute
- RSS Feed
- Permalink
- Report Inappropriate Content
Hi,
I want to display yaxis values like 10 {superscript}0, 10 {superscript}1, 10 {superscript}2 etc .. is there a way I can put 0, 1, 2 etc as a superscript on yaxis values?
Thanks,
- Mark as New
- Bookmark
- Subscribe
- Mute
- RSS Feed
- Permalink
- Report Inappropriate Content
These axis tick values make sense for a log axis. Then, equally spaced tick values can have 10**2, 10**3, etc. For log axis use TYPE=log on the axis statement for SGPLOT.
It is a little harder to understand this for a linear axis, you likely have numbers like 100, 200, 300 to 800. In this case, just a 10**2, 10**3 may not suffice. Please provide more details, or attach a picture. With SAS 9.3, you can use the SGANNO facility to make such customizations.
- Mark as New
- Bookmark
- Subscribe
- Mute
- RSS Feed
- Permalink
- Report Inappropriate Content
Thanks Sanjay,
My Yaxis is log. Attached is the picture of the graph. What I want is 10 (to the power) -2 and so on ..
- Mark as New
- Bookmark
- Subscribe
- Mute
- RSS Feed
- Permalink
- Report Inappropriate Content
Also, forgot to mention that I am using SAS 9.2
Thanks
- Mark as New
- Bookmark
- Subscribe
- Mute
- RSS Feed
- Permalink
- Report Inappropriate Content
This looks like a simple log axis available with With SAS 9.2 SGPLOT. Set axis TYPE=LOG, base 10 is default. Use LOGSTYLE option:
LOGSTYLE= LOGEXPAND | LOGEXPONENT | LINEAR. Logexpand will show you 0.1, 1, 10, 100, 1000 on the Y axis. Log exponenet will display only the exponent - -2, -1, 0, 1, 2, 3. With SAS 9.2, I cannot think of a way to get 10^3 like you want.
- Mark as New
- Bookmark
- Subscribe
- Mute
- RSS Feed
- Permalink
- Report Inappropriate Content
SFO,
I think you'll have to hard-code each axis tickmark to use the superscript characters in gplot.
Since recent versions of SAS/Graph support unicode, you can do this using the built-in superscripted characters of a font such as "arial unicode ms". The characters and their numeric codes are described here:
Unicode subscripts and superscripts - Wikipedia, the free encyclopedia
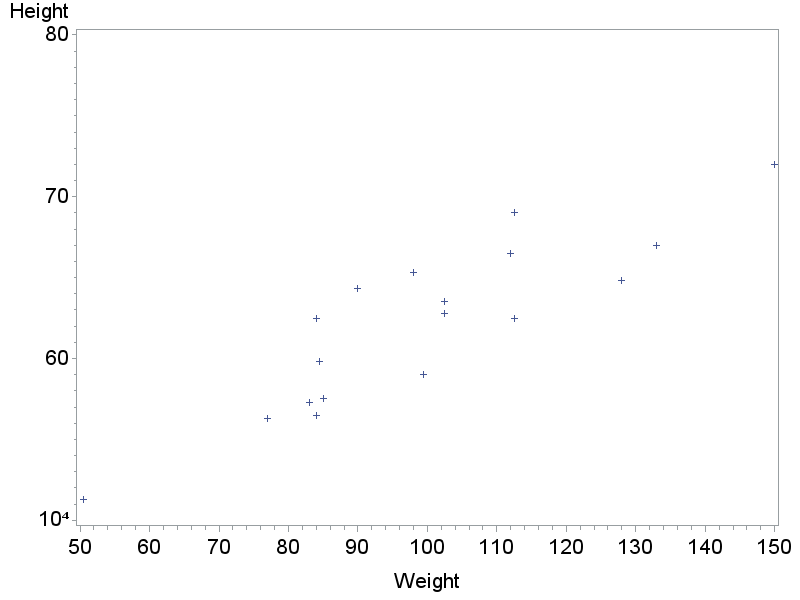
For example, the hex code '2074'x represents a superscripted '4' and can be hard-coded as an axis tickmark as follows (this example shows how to hard-code it in the first tick mark of the y-axis):
goptions htext=3.5pct;
axis1 value=(t=1 '10' font="arial unicode ms/unicode" '2074'x);
proc gplot data=sashelp.class;
plot height*weight / vaxis=axis1;
run;

- Mark as New
- Bookmark
- Subscribe
- Mute
- RSS Feed
- Permalink
- Report Inappropriate Content
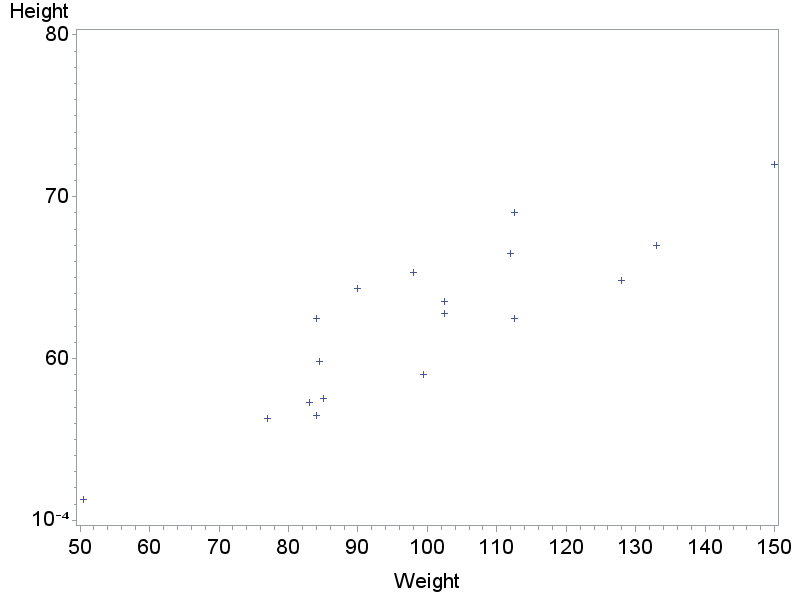
Since some of the numbers you want to superscript will need a minus sign, I'll elaborate a little on that ...
The character for a superscripted 'minus' is '207b'x, and you can combine that with the superscripted number as follows:
goptions htext=3.5pct;
axis1 value=(t=1 '10' font="arial unicode ms/unicode" '207b2074'x);
proc gplot data=sashelp.class;
plot height*weight / vaxis=axis1;
run;

April 27 – 30 | Gaylord Texan | Grapevine, Texas
Registration is open
Walk in ready to learn. Walk out ready to deliver. This is the data and AI conference you can't afford to miss.
Register now and save with the early bird rate—just $795!
Learn how use the CAT functions in SAS to join values from multiple variables into a single value.
Find more tutorials on the SAS Users YouTube channel.
SAS Training: Just a Click Away
Ready to level-up your skills? Choose your own adventure.


