- Home
- /
- Programming
- /
- Graphics
- /
- Adding ESRI Shapefiles to US Map
- RSS Feed
- Mark Topic as New
- Mark Topic as Read
- Float this Topic for Current User
- Bookmark
- Subscribe
- Mute
- Printer Friendly Page
- Mark as New
- Bookmark
- Subscribe
- Mute
- RSS Feed
- Permalink
- Report Inappropriate Content
I am trying to map some custom regions all of which are in the US. Unfortunately, the only geographic locations I have are zip codes. I imported my zip code list into ArcGIS and ran a dissolve to get the appropriate regions, then exported to a shape file and imported to SAS using PROC MAPIMPORT. I am facing two problems though:
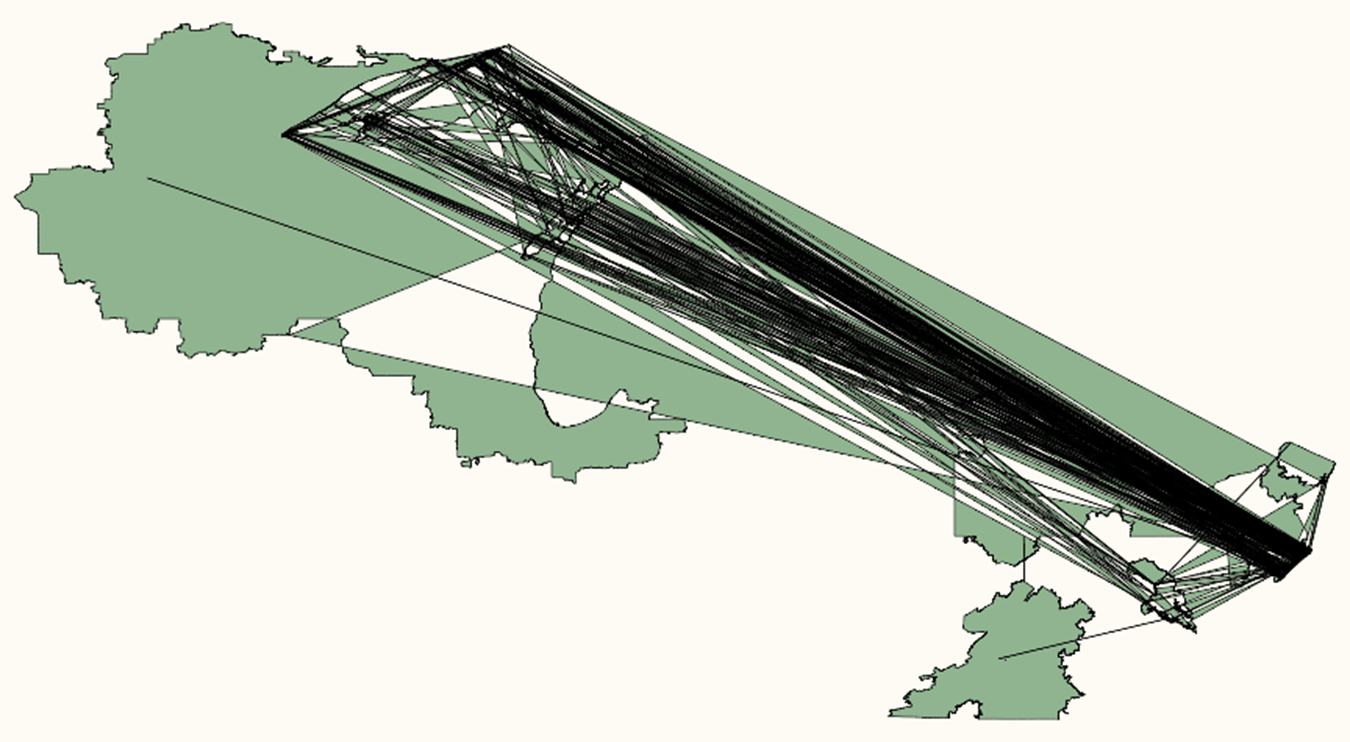
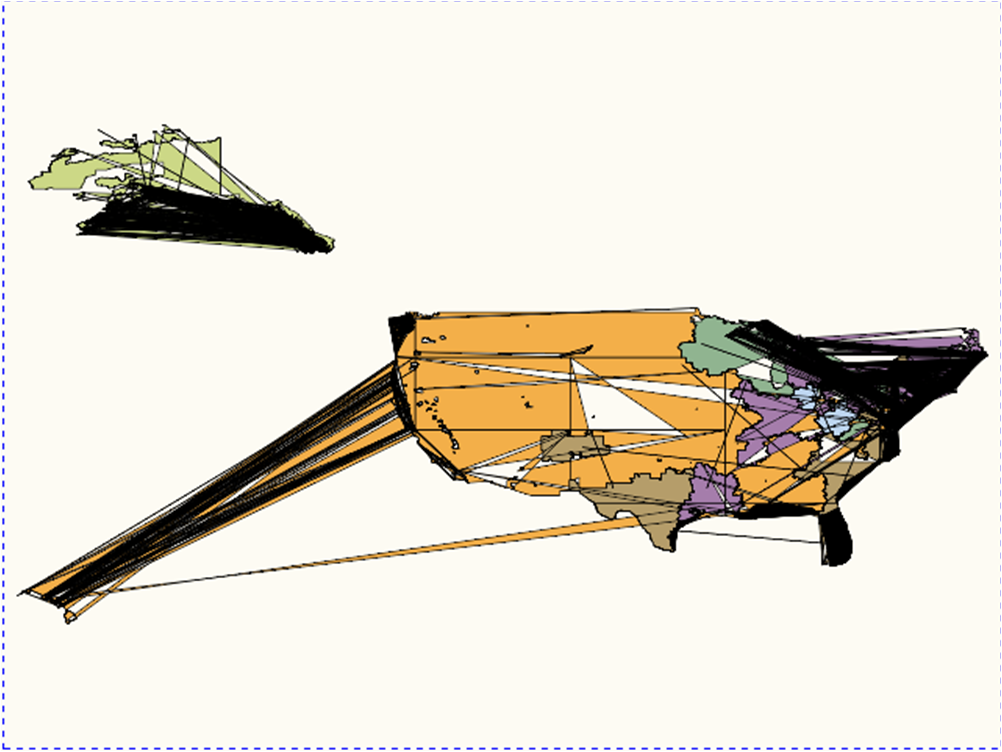
1) The data is "too detailed" i.e. I am getting approx. 7 mm records to map 5 regions across the US. Since the SAS loaded US map only has 1,500, I figure this is too many. I have tried reducing some of the records by taking every 10th record (just as a starting point) and limiting to only one region but the map I am getting isn't right (see attached).
2) My second problem is how to make my regions appear on a US map when I don't have a State Code, just a zip. Do I need to use the zipstate function to be able to link to the maps.us? Currently I am just using a basic GMAP procedure.
I have been using this article as a starting point, and it has been extremely helpful, I am wondering if I just have way more records then the sample and that is why I am having trouble: http://support.sas.com/resources/papers/proceedings09/232-2009.pdf. Any help is appreciated. Thanks.

- Mark as New
- Bookmark
- Subscribe
- Mute
- RSS Feed
- Permalink
- Report Inappropriate Content
You can use Proc Greduce to pre-process your map, and reduce the number of obsns in it.
With your new map, you will be using your new custom regions as the map 'id' (you will not be using the zip code or state as the id in the new map).
- Mark as New
- Bookmark
- Subscribe
- Mute
- RSS Feed
- Permalink
- Report Inappropriate Content
It's getting closer, but at density = 2, I am still getting a lot of lines running across the region. Is that because there are still too many data points?

- Mark as New
- Bookmark
- Subscribe
- Mute
- RSS Feed
- Permalink
- Report Inappropriate Content
This sometimes happens when the observations in the SAS map data set are not in the correct order (gmap connects the points in the order it finds them in the data) - sometimes an sql join, or other procs you might use on the data, will change the order.
Perhaps you're not using the right id variable?
Perhaps something didn't work quite right about creating the custom map in arcGIS, exporting it, importing it into SAS, etc?
This might be one of those detailed questions you'll have to work one-on-one with someone from Tech Support to figure out.
- Mark as New
- Bookmark
- Subscribe
- Mute
- RSS Feed
- Permalink
- Report Inappropriate Content
I had a look at your "Region Sample.xlsb" just now, and the data appears to be sorted by the X (longitude) values (I visually noticed this in Excel, and plotted the data with gplot and that seems to confirm that the data is sorted by X).
I'm not sure at what point in the process they got sorted, but I think that's the main problem (the obsns should appear in the data set in the order they should be connected along the border of the map area).
Here's the code I used to import & plot the x/y points with gplot:
PROC IMPORT OUT=custom_map DATAFILE="Region Sample.xlsb" DBMS=EXCEL REPLACE;
GETNAMES=YES;
MIXED=NO;
SCANTEXT=YES;
RUN;
proc gplot data=custom_map;
plot y*x;
run;
- Mark as New
- Bookmark
- Subscribe
- Mute
- RSS Feed
- Permalink
- Report Inappropriate Content
That does explain a lot more of what happened. Before using PROC GREMOVE, I was trying to reduce the records by sorting X and Y and taking every 10th record. Now that I have reverted to the original shapefile source, it is looking better, but I an still getting a lot of lines running back and forth over the map. I believe this is because some of my regions, while in the same region, are not continuous (for example, having WA, OR and NM in a "West" region, but not CA). I am thinking I may be able to get around this be defining labels for only continuous regions and then just using the annotate step to label them, but is there a better way to do this? So that SAS doesn't draw lines back and forth over the regions.
- Mark as New
- Bookmark
- Subscribe
- Mute
- RSS Feed
- Permalink
- Report Inappropriate Content
If your map areas (regions) have multiple non-connected polygons, then you'll need to have a 'segment' variable in your map data set, so that gmap will know to create them as discontinuous areas.
For example, in maps.us Michigan has 2 segments (numbered 1 and 2) -- see the 'segment' variable in the following map data...
data foo; set maps.us (where=(statecode='MI'));
run;
- Mark as New
- Bookmark
- Subscribe
- Mute
- RSS Feed
- Permalink
- Report Inappropriate Content
Follow up: I was able to get a Map Info File which contains a drastically reduced data set that covers the same regions. Is there a way to map using X Center, Y Center and a Polygon shape area using GMAP?
- Mark as New
- Bookmark
- Subscribe
- Mute
- RSS Feed
- Permalink
- Report Inappropriate Content
In case anyone else ever needs to use X/Y data from a Map Info File, you can use the maparea variable as an ID variable to map and at least in my case, it creates a much cleaner map than using other ID variables. Thanks.
Learn how use the CAT functions in SAS to join values from multiple variables into a single value.
Find more tutorials on the SAS Users YouTube channel.
SAS Training: Just a Click Away
Ready to level-up your skills? Choose your own adventure.


