- Home
- /
- Programming
- /
- Graphics
- /
- Add space between bars
- RSS Feed
- Mark Topic as New
- Mark Topic as Read
- Float this Topic for Current User
- Bookmark
- Subscribe
- Mute
- Printer Friendly Page
- Mark as New
- Bookmark
- Subscribe
- Mute
- RSS Feed
- Permalink
- Report Inappropriate Content
Hi,
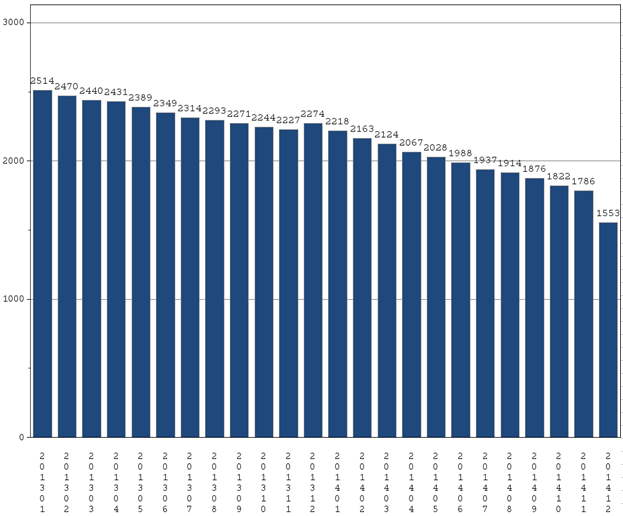
In below graph you can see number labels are so congested. Also if number of digits gets more than 4 then it doesn't display at all.
I was wondering if there is a way to fix this. Can we increase space between bars?

- Mark as New
- Bookmark
- Subscribe
- Mute
- RSS Feed
- Permalink
- Report Inappropriate Content
Code used to create the graph as the procedure, the output destination (HTML, RTF, PDF or other) AND which SAS version you are running has bearing on solutions.
- Mark as New
- Bookmark
- Subscribe
- Mute
- RSS Feed
- Permalink
- Report Inappropriate Content
I'm creating Excel output by running following code in SAS 9.4:
options device=ACTXIMG nobyline;
goptions device=png rotate=landscape ;
ods graphics on;
ods excel
options(sheet_interval='none' sheet_name='Graph Output' sheet_label=' ' suppress_bylines='yes'
orientation='landscape' embedded_titles='yes' center_horizontal='yes'
embedded_footnotes='yes')
style=minimal ;
PATTERN1 COLOR=CX1F497D;
Axis1 STYLE=1 WIDTH=1 MINOR=(NUMBER=1) LABEL=(f="calibri/Bold" "Group Counts" ) value=(h=8pt) ;
Axis2 STYLE=1 WIDTH=1 LABEL=( f="calibri/Bold" "Enrollment Date CCYYMM" )value=(h=8pt);
TITLE underlin=2 "#byval(region)";
FOOTNOTE;
PROC GCHART DATA=REGIONGRPCNT ;
BY region;
VBAR ccyy /width=5 SUMVAR=grpcnt CLIPREF FRAME DISCRETE TYPE=SUM space=3
SUM
COUTLINE=GRAY
RAXIS=AXIS1
MAXIS=AXIS2
LREF=1
CREF=GRAY
AUTOREF ;
RUN;
ods excel close;
- Mark as New
- Bookmark
- Subscribe
- Mute
- RSS Feed
- Permalink
- Report Inappropriate Content
Sorry, I can't help much as I don't have 9.4 and our IT won't let us generate activex anything. If fitting on a printed page isn't quite an issue then increasing the setting of HSIZE in the goptions statement might help.
- Mark as New
- Bookmark
- Subscribe
- Mute
- RSS Feed
- Permalink
- Report Inappropriate Content
You would need to make the graph itself wider, in order for the bars to be wider.
I'm not sure about activex, but with device=png, you can use 'goptions xpixels=1000;'
Once the page is wider, the gchart bars typically auto-size to fill up a 'comfortable' amount of the space, but you can further refine/control the bar width using the width= option.
Here's a small example:
goptions device=png xpixels=1000;
proc gchart data=sashelp.electric;
vbar year / discrete type=sum sumvar=revenue outside=sum width=8;
run;
Learn how use the CAT functions in SAS to join values from multiple variables into a single value.
Find more tutorials on the SAS Users YouTube channel.
SAS Training: Just a Click Away
Ready to level-up your skills? Choose your own adventure.


