- Home
- /
- Programming
- /
- Graphics
- /
- A map that is both Choropleth and Riser?
- RSS Feed
- Mark Topic as New
- Mark Topic as Read
- Float this Topic for Current User
- Bookmark
- Subscribe
- Mute
- Printer Friendly Page
- Mark as New
- Bookmark
- Subscribe
- Mute
- RSS Feed
- Permalink
- Report Inappropriate Content
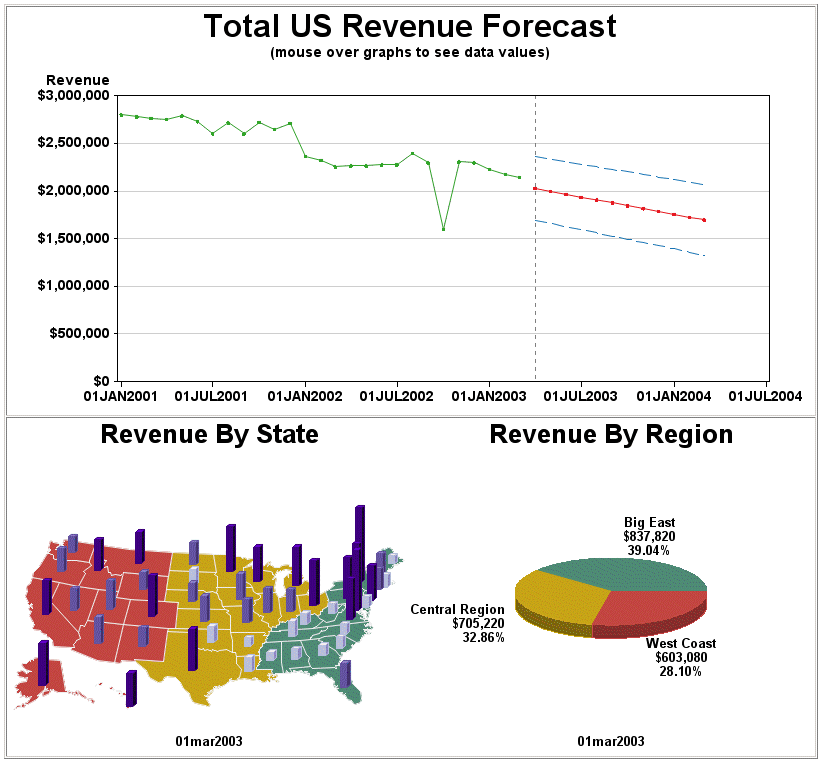
Is it possible to create a map that is both Choropleth and Riser? If so, how? I'm using Enterprize Guide. Is there an easy way to do it using the Graph/Map task?
- Mark as New
- Bookmark
- Subscribe
- Mute
- RSS Feed
- Permalink
- Report Inappropriate Content
It is possible to create a map that is both shaded by the areas (choro), and also has bars centered in the areas (block map) in recent versions of SAS. The syntax is a little tricky, and it is probably best to start with a working example, and modify it to use your data. I'm not 100% sure, but I doubt Enterprize Guide has an interface for this specific capability.
The map in the bottom/left of this example might be a good/simple one to get you started on the code:
http://robslink.com/SAS/democd5/revenue_info.htm

Learn how use the CAT functions in SAS to join values from multiple variables into a single value.
Find more tutorials on the SAS Users YouTube channel.
SAS Training: Just a Click Away
Ready to level-up your skills? Choose your own adventure.


