- Home
- /
- Analytics
- /
- Stat Procs
- /
- Parameterization of Gamma distribution used in PROC FMM
- RSS Feed
- Mark Topic as New
- Mark Topic as Read
- Float this Topic for Current User
- Bookmark
- Subscribe
- Mute
- Printer Friendly Page
- Mark as New
- Bookmark
- Subscribe
- Mute
- RSS Feed
- Permalink
- Report Inappropriate Content
I am trying to figure out the parameterization of Gamma distribution used in PROC FMM. When I think of the typical Gamma(shape=alpha , rate=beta) parameterization, I at first assumed alpha = (FMM's scale) and beta = (FMM's scale) / (FMM's intercept) based on the likelihood shown in the documentation. But that does not seem true and the documentation says that by default a log-link function is used. However, it is not clear at all from the documentation whether this means I need to use exp(FMM's intercept) and perhaps some other transformation on FMM's scale?
Below is an example of what I might be doing:
data test;
do i=1 to 1000000;
y = 10*rangam(123,10);
output;
end;
run;
proc fmm;
model y = / dist=gamma k=1;
run;
This gave me:
| Intercept | 4.6050 | 0.000316 | 14557.2 | <.0001 | 99.9813 |
|---|---|---|---|---|---|
| Scale Parameter | 9.9931 | 0.01390 |
If I now wanted to use the PDF function to simply re-plot the density, what are the shape and scale???
data replot;
do x=0 to 100 by 1;
density = PDF("GAMMA",x,shape,scale);
output;
end;
run;
proc sgplot data=replot;
series x=x y=density;
run;
I would be grateful, if anyone could tell me exactly how PROC FMM really parameterizes the gamma distribution.
Many thanks,
Björn
- Mark as New
- Bookmark
- Subscribe
- Mute
- RSS Feed
- Permalink
- Report Inappropriate Content
The parameterization is in terms of the mean and dispersion, not the standard shape and scale parameters for the gamma distribution.
This is the same as GENMOD does, and the doc says
"Probability distributions of the response Y in generalized linear models are usually parameterized in terms of the mean ![]() and dispersion parameter
and dispersion parameter ![]() instead of the natural parameter
instead of the natural parameter ![]() "
"
But that's okay, because you can convert between the two parameters. If alpha, beta are the shape and scale parameters, respectively, for the gamma distribution, then
intercept = mean = alpha*beta
dispersion = alpha;
There is some interesting geometry in the conversion. If you like math, you might enjoy reading an article I wrote about converting between mean/std and the mu/sigma parameters for the lognormal d...
The other important aspect of this problem is that the DIST= option activates the LINK= option. In your code, you were implicitly using LINK=LOG, which is the default link function for the gamma distribution. The following code should show you how to convert to the standard gamma parameters:
%let shape = 11; /* gamma shape */
%let scale = 4; /* gamma scale */
data Sim;
call streaminit(12345);
do i = 1 to 10000;
y = &scale * rand("Gamma", &shape);
output;
end;
run;
ods graphics off;
proc fmm data=Sim ITDETAILS;
model y = / dist=gamma k=1 link=identity; /* note LINK= ! */
run;
/* convert intercept/dispersion estimates to shape/scale estimates */
data Params;
fmm_int = 44.1356; /* COPY/PASTE from the PROC FMM output */
fmm_scale = 10.9620;
call symputx("gam_scale", fmm_int / fmm_scale);
call symputx("gam_shape", fmm_scale);
run;
%put gam_scale= &gam_scale;
%put gam_shape= &gam_shape;
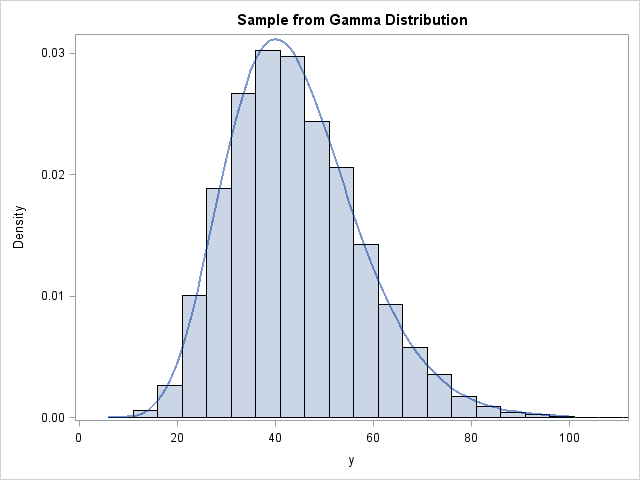
If you read the article "How to overlay a custom density curve on a histogram in SAS" you can overlay the estimated gamma density on the simulated data.

- Mark as New
- Bookmark
- Subscribe
- Mute
- RSS Feed
- Permalink
- Report Inappropriate Content
Thanks! That gets me around having to understand exactly how the model is parameterized in case of the log-link function.
- Mark as New
- Bookmark
- Subscribe
- Mute
- RSS Feed
- Permalink
- Report Inappropriate Content
For the weibull estimates from proc fmm the mapping goes as well like this?
intercept = mean = alpha*beta
dispersion = alpha;
I'd like to understand it but I don't know where to start.
- Mark as New
- Bookmark
- Subscribe
- Mute
- RSS Feed
- Permalink
- Report Inappropriate Content
See my response in the comments of this blog post.
- Mark as New
- Bookmark
- Subscribe
- Mute
- RSS Feed
- Permalink
- Report Inappropriate Content
As discussed in this note, the parameterization of the gamma distribution that you are used to is directly used by PROC NLMIXED, so this is much easier in that procedure as below:
proc nlmixed;
model y~gamma(a,lambda);
run;
data replot;
     do x=0 to 250 by 1;
          density = PDF("GAMMA",x,9.9931,10.0051);
     output;
     end;
run;
proc sgplot data=replot;
  series x=x y=density;
run;
See also this note on the gamma in GENMOD and the functions like PDF.
ANOVA, or Analysis Of Variance, is used to compare the averages or means of two or more populations to better understand how they differ. Watch this tutorial for more.
Find more tutorials on the SAS Users YouTube channel.


