Hello all,
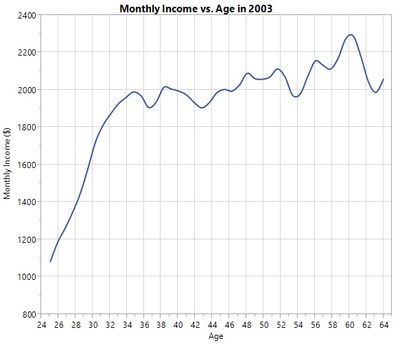
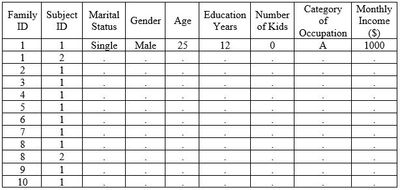
I have financial data of subjects that were chosen for a survey. The variable of interest (the dependent variable) is the subject's income. The main question, is to test the relation between the income and the age. Other covariates in the data are such as: marital status, gender, years of education and more. In addition, some subjects comes from the same family (probably the family was chosen by random, and if it contained only one subject over 18, he/she were chosen, and if more than one subjects, they all were chosen). I wish to create a model that will test the impact of age on the income, while controlling for the other covariates. But, looking at a plot of age vs. income, the relation looks non-linear. Theoretically, it should be parabolic, but in the data it is a bit different. I am attaching the plot so you can see. The plot is a smoothed line, since there are many observations with the same age, and a scatter is not very clear to understand.
I would like to ask your help in writting the SAS code for it. I understand that PROC NLMIXED is what I want. I am not sure how to model correctly (the formula, starting points, etc...).
Thank you in advance !
P.S. I can create a uniqe ID for each subject by connecting family ID and subject ID.