Hello all,
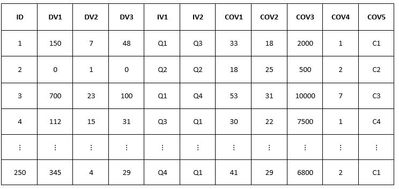
I have a dataset from the medical intudstry. An example of the data you can see in the attached table (image).

I have 3 dependent variables, all continous, some transformed due to non-normality, some not. In addition, I have two independent variables, which are the variables to be testes (the main research variables). Both came from a factor analysis (the first two factors).
The two first factor scores where categorized to quartiles (Q1, Q2, Q3 or Q4) using PROC RANK.
In addition, I have several covariates, which I need for adjustment. Such covariates are age, BMI, smoking habbits, etc.
The main target of the analysis is to look for differences in the means of all DV's by groups of both IV's, meaning, for each DV to see if there are differences between the different quartiles for each IV.
I have several questions, which I hope you can assist me with, some of them are more technical, some methodological. I am using SAS 9.4.
1) I need a regression model that will yield the adjusted means (LSMEANS). I am not sure which SAS procedure to use here: REG, GLM or GLIMMIX.
2) In comparing the quartiles (for each IV), I am interested in checking if there is a trend (for example, if the adjusted mean of Q4> mean of Q3> mean of Q2> mean of Q1). Is there a test that does that in SAS? In addition, I will be interested in simply comparing a couple of quartiles (mainly Q4 vs Q1). How should I get SAS to do that, to makes pair comparisons, while correcting the significance level? Should I use "contrast" or "estimate" ?
3) Methodologically, or theoretically, I need to adjust for some covariates, such as age and BMI. Since I have quite a few of them, putting too many variables in the model doesn't risk the effect of the IV's to be gone completely? Or on the other hand, doesn't it brings risk for overfitting? Is there a risk of "over-adjusting", which will make effects to vanish? What is the best way to handle it ? Does SAS knows how to choose the best subset (including two way interactions) ?
Thank you in advance for any tips you can give me.