- Home
- /
- SAS Viya
- /
- Visual Analytics
- /
- Re: Time slider with dynamic range for last 2 months
- RSS Feed
- Mark Topic as New
- Mark Topic as Read
- Float this Topic for Current User
- Bookmark
- Subscribe
- Mute
- Printer Friendly Page
- Mark as New
- Bookmark
- Subscribe
- Mute
- RSS Feed
- Permalink
- Report Inappropriate Content
Here is another way of doing this that allows you to filter the results for a rolling 30 days from the last date you choose.
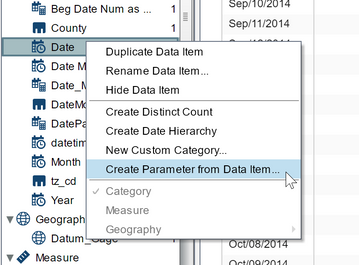
From the Data panel, right click on your Date field (mine was called Date) and select Create Parameter from Data Item.
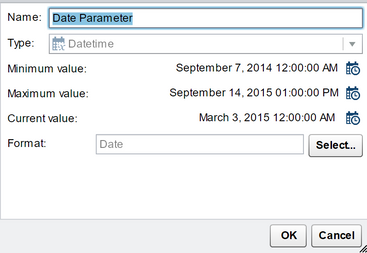
Name it Date Parameter and click ok.
Now we’ll add a couple of calculated Items. The first one will hold the ending date.
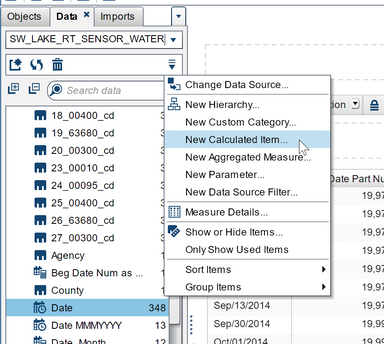
From the Data Pane, select the Options icon, then click New Calculated Item.
Name the new calculated item end date num. Click on the Text tab and cut and paste the following text:
TreatAs(_Number_, DatePart('Date Parameter'p))
Note: my Date field was a DateTime value so I had to add the DatePart function. If your field is a just a date value then you don’t need the DatePart. Your text should read TreatAs(_Number_, 'Date Parameter'p)
Click Ok.
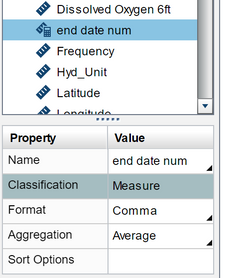
Select end date num and set the Aggregation to Average.
Now we’ll create a new calculated item for the beginning date (30 days prior to our end date).
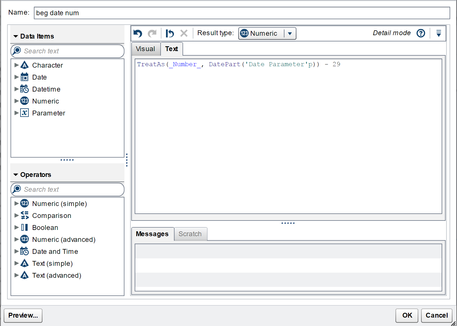
Using the Options menu again, select New Calculated Item. Enter beg date num for the name. Click on the Text tab and copy and paste the following text: TreatAs(_Number_, DatePart('Date Parameter'p)) – 29.
Remember: If your date field is not a datetime format you will need to remove the DatePart. Your text should read this: TreatAs(_Number_, 'Date Parameter'p) – 29.
Click Ok.
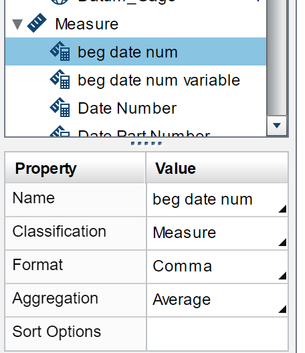
Set the aggregation to Average for beg date num.
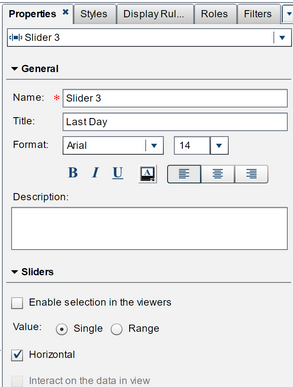
Add a slider to your report and select the Properties tab and choose Single for the value.
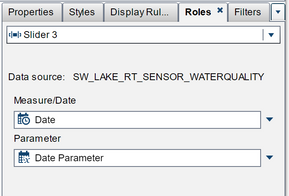
Under roles choose your Date field as the Measure/Date and choose Date Parameter as your Parameter.
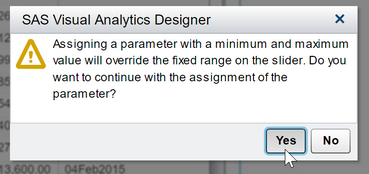
Click Yes when the following pop-up message appears.
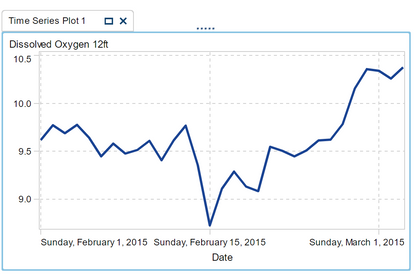
Add a chart that you want to filter your data by the last 30 days for. Set up your roles for what you want to display. In my case I added a time series line chart that is displaying Oxygen levels in water.
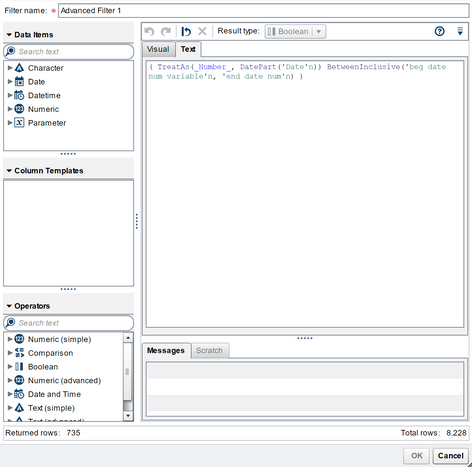
Select the filters tab for your chart. Click Add Filter, click on the Text tab and copy and paste the following text.
( TreatAs(_Number_, DatePart('Date'n)) BetweenInclusive('beg date num'n, 'end date num'n) )
NOTE: if your Date field is not DateTime format you will need to remove the DatePart. Also, your date field name maybe different from mine. So, you’ll have to change Date to the name of your date field. Your text should read this: ( TreatAs(_Number_, 'Date'n) BetweenInclusive('beg date num'n, 'end date num'n) )
Your chart should now show a rolling 30 days depending on the date shown in the slider.
Hope this helps!
Melanie
- Mark as New
- Bookmark
- Subscribe
- Mute
- RSS Feed
- Permalink
- Report Inappropriate Content
Hi Victor, Sorry for late reply. Actually I faced the same issue. Try to do this way, it will work.
1) Create calculated Item
2) Change format:-
3) select the filed "Year" and right click on it and select Category option
4) Select slider object and then click the Rank tab
5) Select "Year" then Click on "Add Rank" button then choose "Top Count" from the drop down then make sure the radio button is selected as "Count". Then enter 10, 20, 50 and so on in the box (respectively this will give you the last 10 years, 20 years, 50 years and so on). And "By:" option select Registration_Date and Include "Ties".
6) After that, you can select min and max date only for one time and from the next day it will automatically selected max date as per data.
Regards,
Sunny
- Mark as New
- Bookmark
- Subscribe
- Mute
- RSS Feed
- Permalink
- Report Inappropriate Content
Hi guys,
hope you are well. I'm having a little trouble with SAS VA 7.4, I'd be glad if you could help me.
I have data from two years: 2017 and 2018 (I'm interested in a numerical variable). I put a slider (period) that's filtered, to show only 2018 values.
I want to make a bar chart, that shows, for a category, the cumulative amount for the selected period in the slider (no problem with that) but also the cumulative amount for the same month in the previous year.
The blue bars are ok but not the Green ones (cumulative period of the same month, previous year). I'm trying with the aggregated measure "cumulative period" set for previous year (-1) but it doesn't work, and don't know why, although it worked well when using it in a cross table with "period" as columns.
Can you help me?
Thanks and regards!!
- « Previous
-
- 1
- 2
- Next »
See how to use one filter for multiple data sources by mapping your data from SAS’ Alexandria McCall.
Find more tutorials on the SAS Users YouTube channel.
